
Crowdmapping for organizations
Put it on the map.Set up in a few minutes.
For public administration, policy makers, NGOs, initiatives and journalism. No coding needed.
See it in action
From data collection to insights
People report problems, collect ideas and map important places, each with a photo and a location.
Take a photo, the AI suggests category and text
People upload a photo. The AI suggests category, description and attributes. The person checks, changes what is needed and sends.

Reports on an interactive map
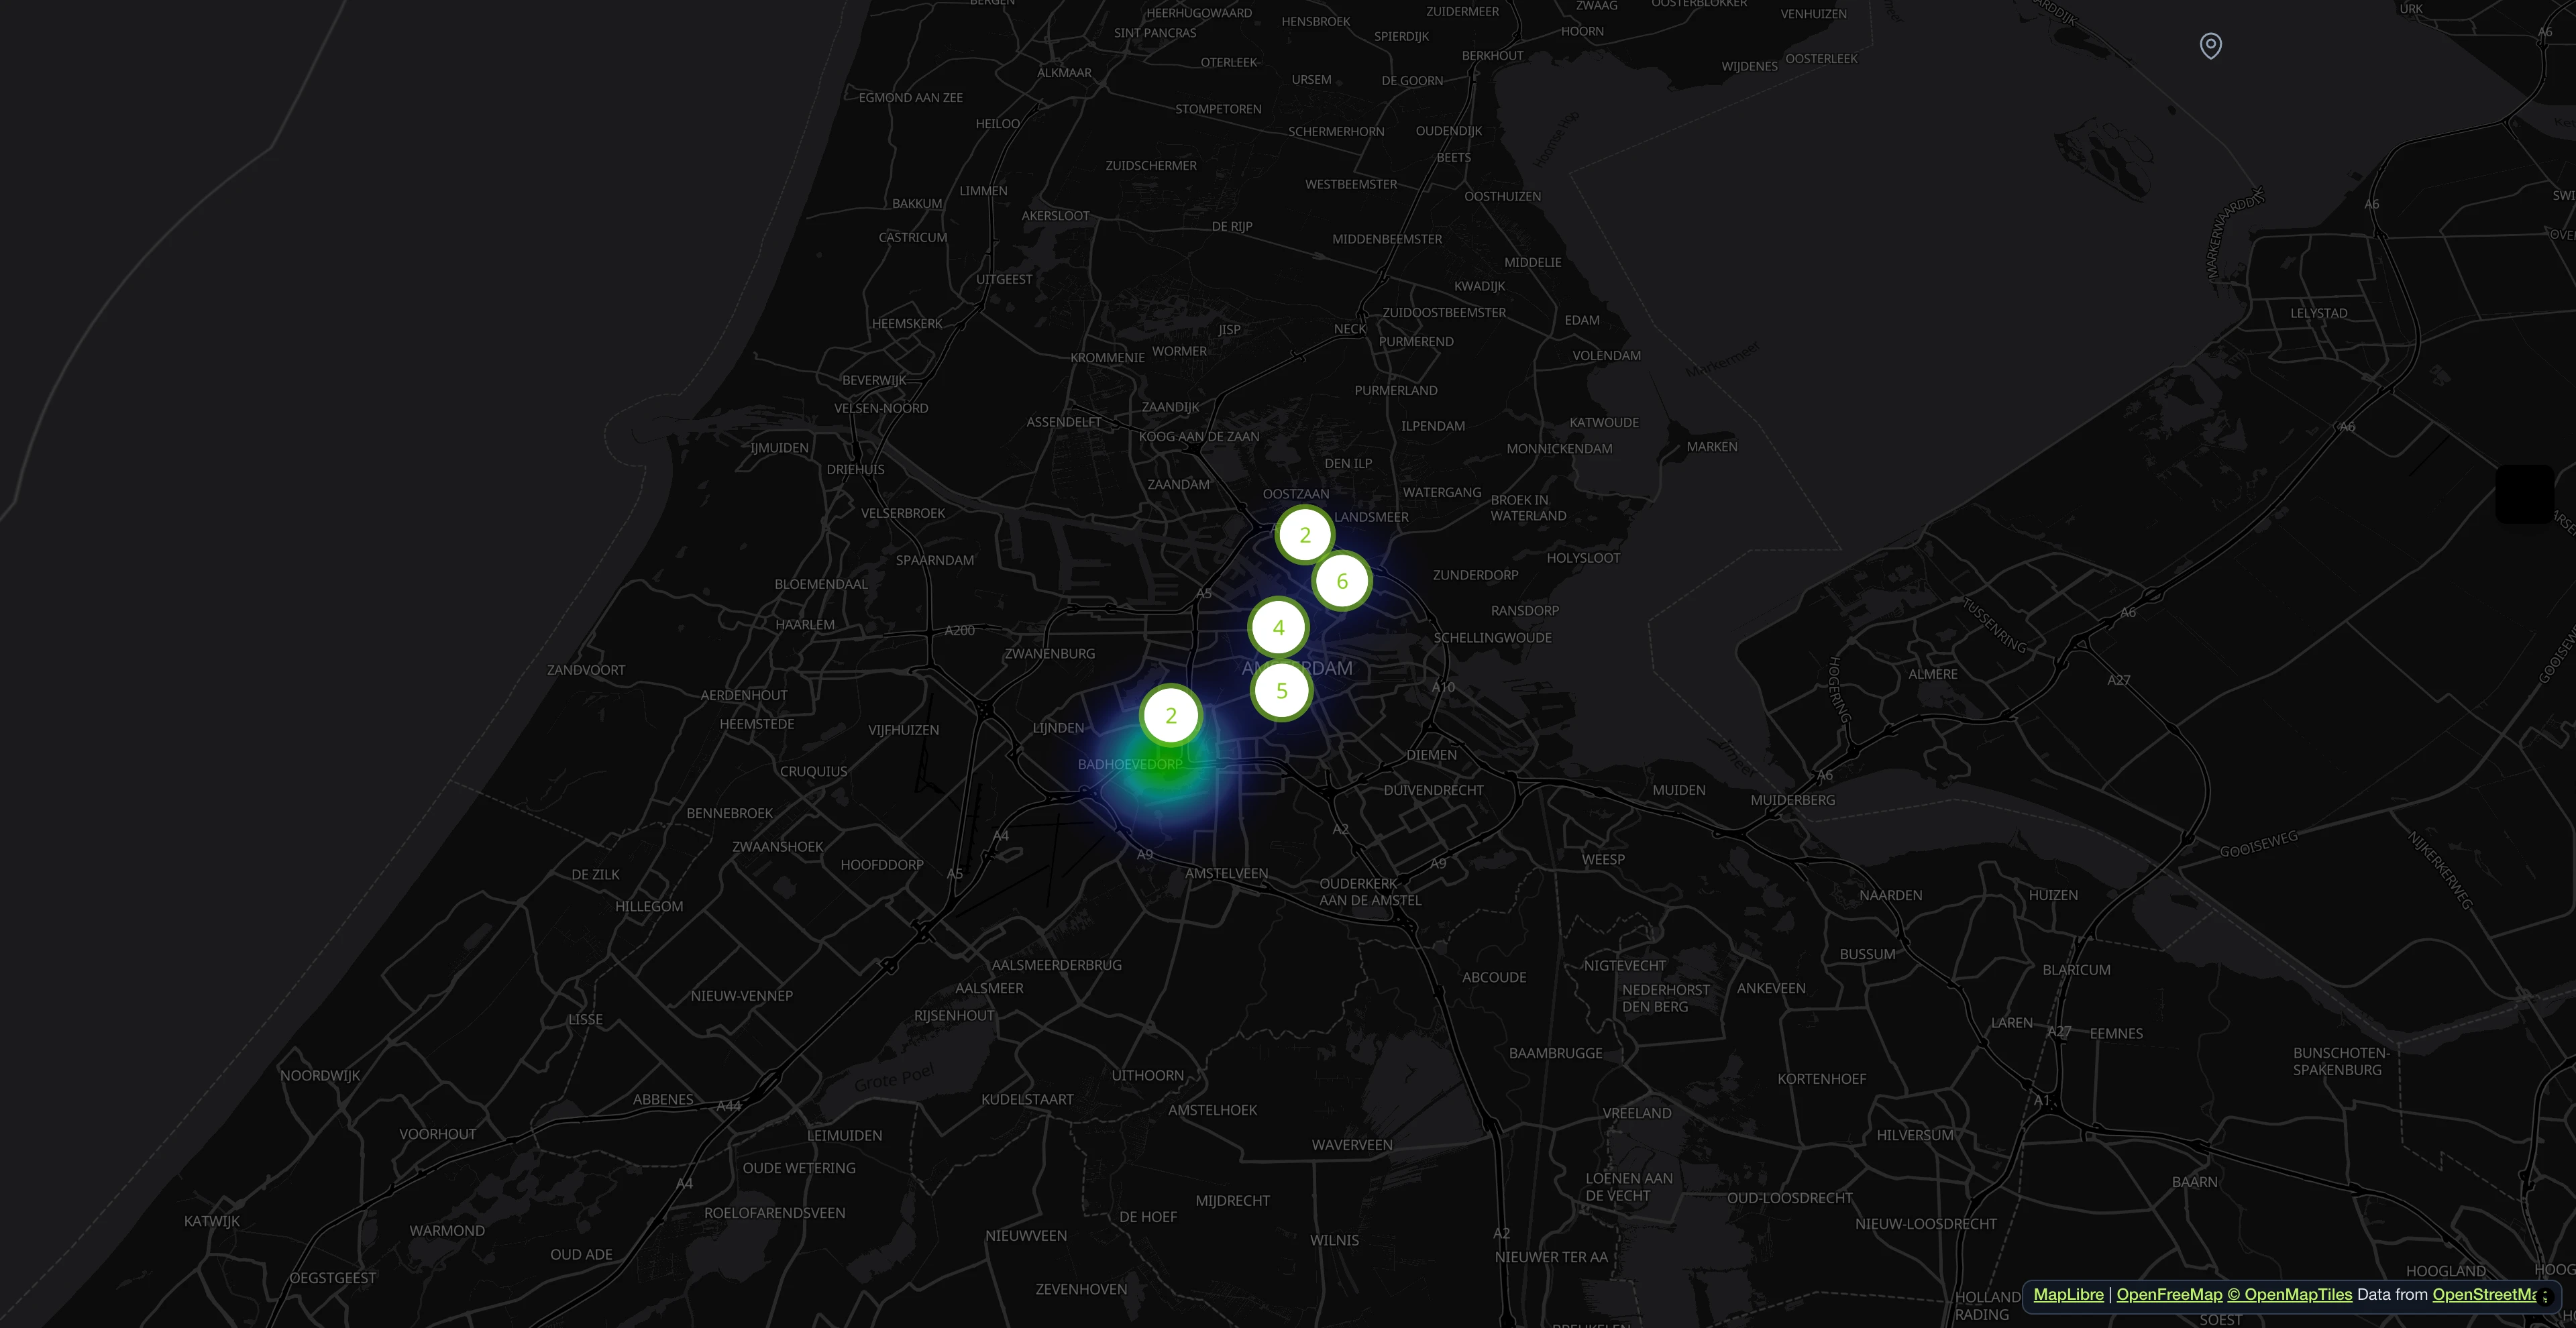
People report problems with a photo and a location. The map shows right away where reports pile up.

All reports at a glance
Search, filter, and sort all incoming reports. Assign departments, update statuses, and keep track of every issue from submission to resolution.

Every report with description and details
The photo brings suggestions for the description, attributes and hazard level. Everything can be changed before sending.

AI-powered processing pipeline
Duplicate reports are detected, hazards rated and fields prefilled. This runs in the background.

Open311-compliant service catalog
Every category is served as an Open311 GeoReport v2 service with typed attributes, dropdown options and per-language labels. No vendor lock-in.

Everything in one dashboard
Key figures, responsibilities and statuses in one place. The AI flags hazards in photos.

- 1M+ reports since 2011
- Open Source
- Open311 GeoReport v2
- EU-hosted
Try it live:demo.mark-a-spot.com/amsterdam
Need facility management, custom WMS layers, structured data fields per workflow status, or multi-district and multi-city setups? Explore the full platform atmark-a-spot.com
Templates
Report, collect, map
Report problems
- Issue Reporter
Report potholes, litter and broken streetlights
- School Route Map
Record dangerous spots on the way to school
- Trail Condition Tracker
Report damage on hiking trails
- Construction Defect & Punch List Software
Document defects on construction sites
Collect ideas
- Community Ideas & Feedback Map
Collect ideas for the neighbourhood
- Create your own
Map places
- Accessibility Barrier Reporter
Map barriers in everyday life
- Urban Climate Risk Map
Map heat islands and flooded spots
- Research & Field Data Collection
Record observations for your own studies
- CrisisMap
Map damage after a disaster
Try a live demo before creating your own map: CrisisMap,School Route Map,Accessibility Barrier Reporter,Urban Climate Risk Map,Trail Condition Tracker,Issue Reporter,Community Ideas & Feedback Map
Browse all templates →
Process
How your map comes together
Choose a template
Pick a use case that fits your project.
Get your map
The map shows your area. Categories and statuses are prefilled. You can adjust them.
Share your map
People contribute data with photos and location. You manage it on a dashboard.
Pricing
Four plans, switch any time.
Free costs nothing. You can switch plans any time in your dashboard.
Free
Perfect for trying it out or small community projects.
- 1 map
- Up to 50 published reports
- 1 admin
- Dashboard and category management
- AI: analyse photos and spot hazards
- Statistics and export
- Your own logo and colours
- Confirmation email to the person reporting
- Open311 interface for reading
- Community support
Starter
Includes applicable tax
For active projects. More reports, more users.
Everything in Free, plus:
- 500 reports/month
- 200 AI photo analyses/month
- 5 users
- Private mode
- Email support
Pro
Includes applicable tax
For teams and organizations. Advanced AI, custom domain, private mode.
Everything in Starter, plus:
- 2,000 reports/month
- 500 AI photo analyses/month
- 20 users
- AI: detect duplicate reports
- Your own domain
- Priority support, answer within 48 hours
- Configurable report forms
- History of all changes
Enterprise
For administrations with fixed processes. Automatic workflows, escalation, your own infrastructure and database.
Everything in Pro, plus:
- Unlimited reports and users
- AI-assisted editing in dashboard
- Status emails to the people reporting
- Automatic workflows
- Escalation rules
To activate your map, add a payment method through Stripe. The Free plan stays at €0 per month. Complete your legal notice with the operator’s details before publishing.
Open Source · Since 2011 · EU Infrastructure
Civic tech built to last.
CivicSpot runs on Mark-a-Spot, an open-source platform for civic reporting and crowdmapping. Used by cities, NGOs, and international organizations. Built on open standards, hosted on EU infrastructure.
The backend is open source under GPL license. The API implements Open311 GeoReport v2, the same standard used by cities from Chicago to Cologne. No vendor lock-in. No proprietary data formats. Self-hosting is always an option.