Report Accessibility Barriers: Map Wheelchair Obstacles & Access Issues
Map accessibility barriers like missing ramps or broken elevators.
Describe your project and we'll create a custom map for you.
What is an accessibility barrier reporter?
Accessibility barriers are physical obstacles that prevent people with disabilities from moving freely through urban space, limiting wheelchair accessibility in everyday environments: missing wheelchair ramps at curb cuts, broken elevators in transit stations, steps at building entrances without handrails, and blocked sidewalks. These barriers are often invisible to city planners because they do not appear in infrastructure databases, only in the lived experience of the people who encounter them.
People affected by mobility limitations, as well as volunteers and advocacy groups, map barriers directly on a shared map. Each report includes a photo taken at the location, the GPS coordinates, and the barrier type, for example missing ramp, broken elevator, or inaccessible building entrance. The photo-documented record is precise enough to be forwarded directly to the responsible municipal office without additional field verification.
Disability advocacy groups and inclusion initiatives use the map to build an evidence base for funding applications and infrastructure planning. Municipalities receive location-specific data that supports prioritization in their barrier-free infrastructure programs. The dataset also helps cities track progress as reported barriers are addressed over time.
Who is this for?
Communities
Resident groups, school parents, neighbourhood initiatives collecting local data.
Organizations
NGOs, nonprofits, and research teams running participatory mapping projects.
Municipalities
City administrations and public agencies managing citizen reports at scale.
Use Cases
Disability Advocacy Groups & Self-Help Organizations
Launch a city-wide barrier mapping campaign. Members report barriers they encounter in daily life. The resulting dataset provides concrete evidence for conversations with city authorities and supports funding applications for barrier removal.
Municipalities & Urban Planning Departments
Receive structured, photo-documented barrier reports from the community. Use the data to identify which neighborhoods have the highest density of unaddressed barriers and to plan investments in accessible infrastructure where they are most needed.
Inclusion Initiatives & Volunteers
Organize targeted mapping sessions in specific districts, around transit hubs, or along main pedestrian routes. Volunteers systematically document barriers in a defined area. The structured output is ready to hand over to the relevant municipal department.
Categories included
Common issues reported include road damage, broken streetlights, illegal dumping, graffiti, and more. Each category can be customized from your dashboard after setup.
What you get
Barrier Type Classification
Reports are categorized by barrier type: missing ramp, broken elevator, missing curb cut, sidewalk obstacle, missing tactile paving, or inaccessible building entrance. Typed data is directly usable for infrastructure planning and funding allocation.
On-Location Photo Documentation
Each report includes a GPS-tagged photo taken at the barrier. The image provides the physical context that a category label alone cannot convey, and it gives municipal offices enough information to act without a separate site visit.
Community Verification
Multiple contributors can report the same barrier independently. Confirmed barriers, reported by more than one person, are visually distinct on the map and receive higher priority in maintenance planning.
Municipal Data Export
Collected reports are exportable in structured formats for direct use in municipal GIS systems and barrier-free infrastructure programs. No manual transcription of field observations required.
See it in action
From data collection to insights
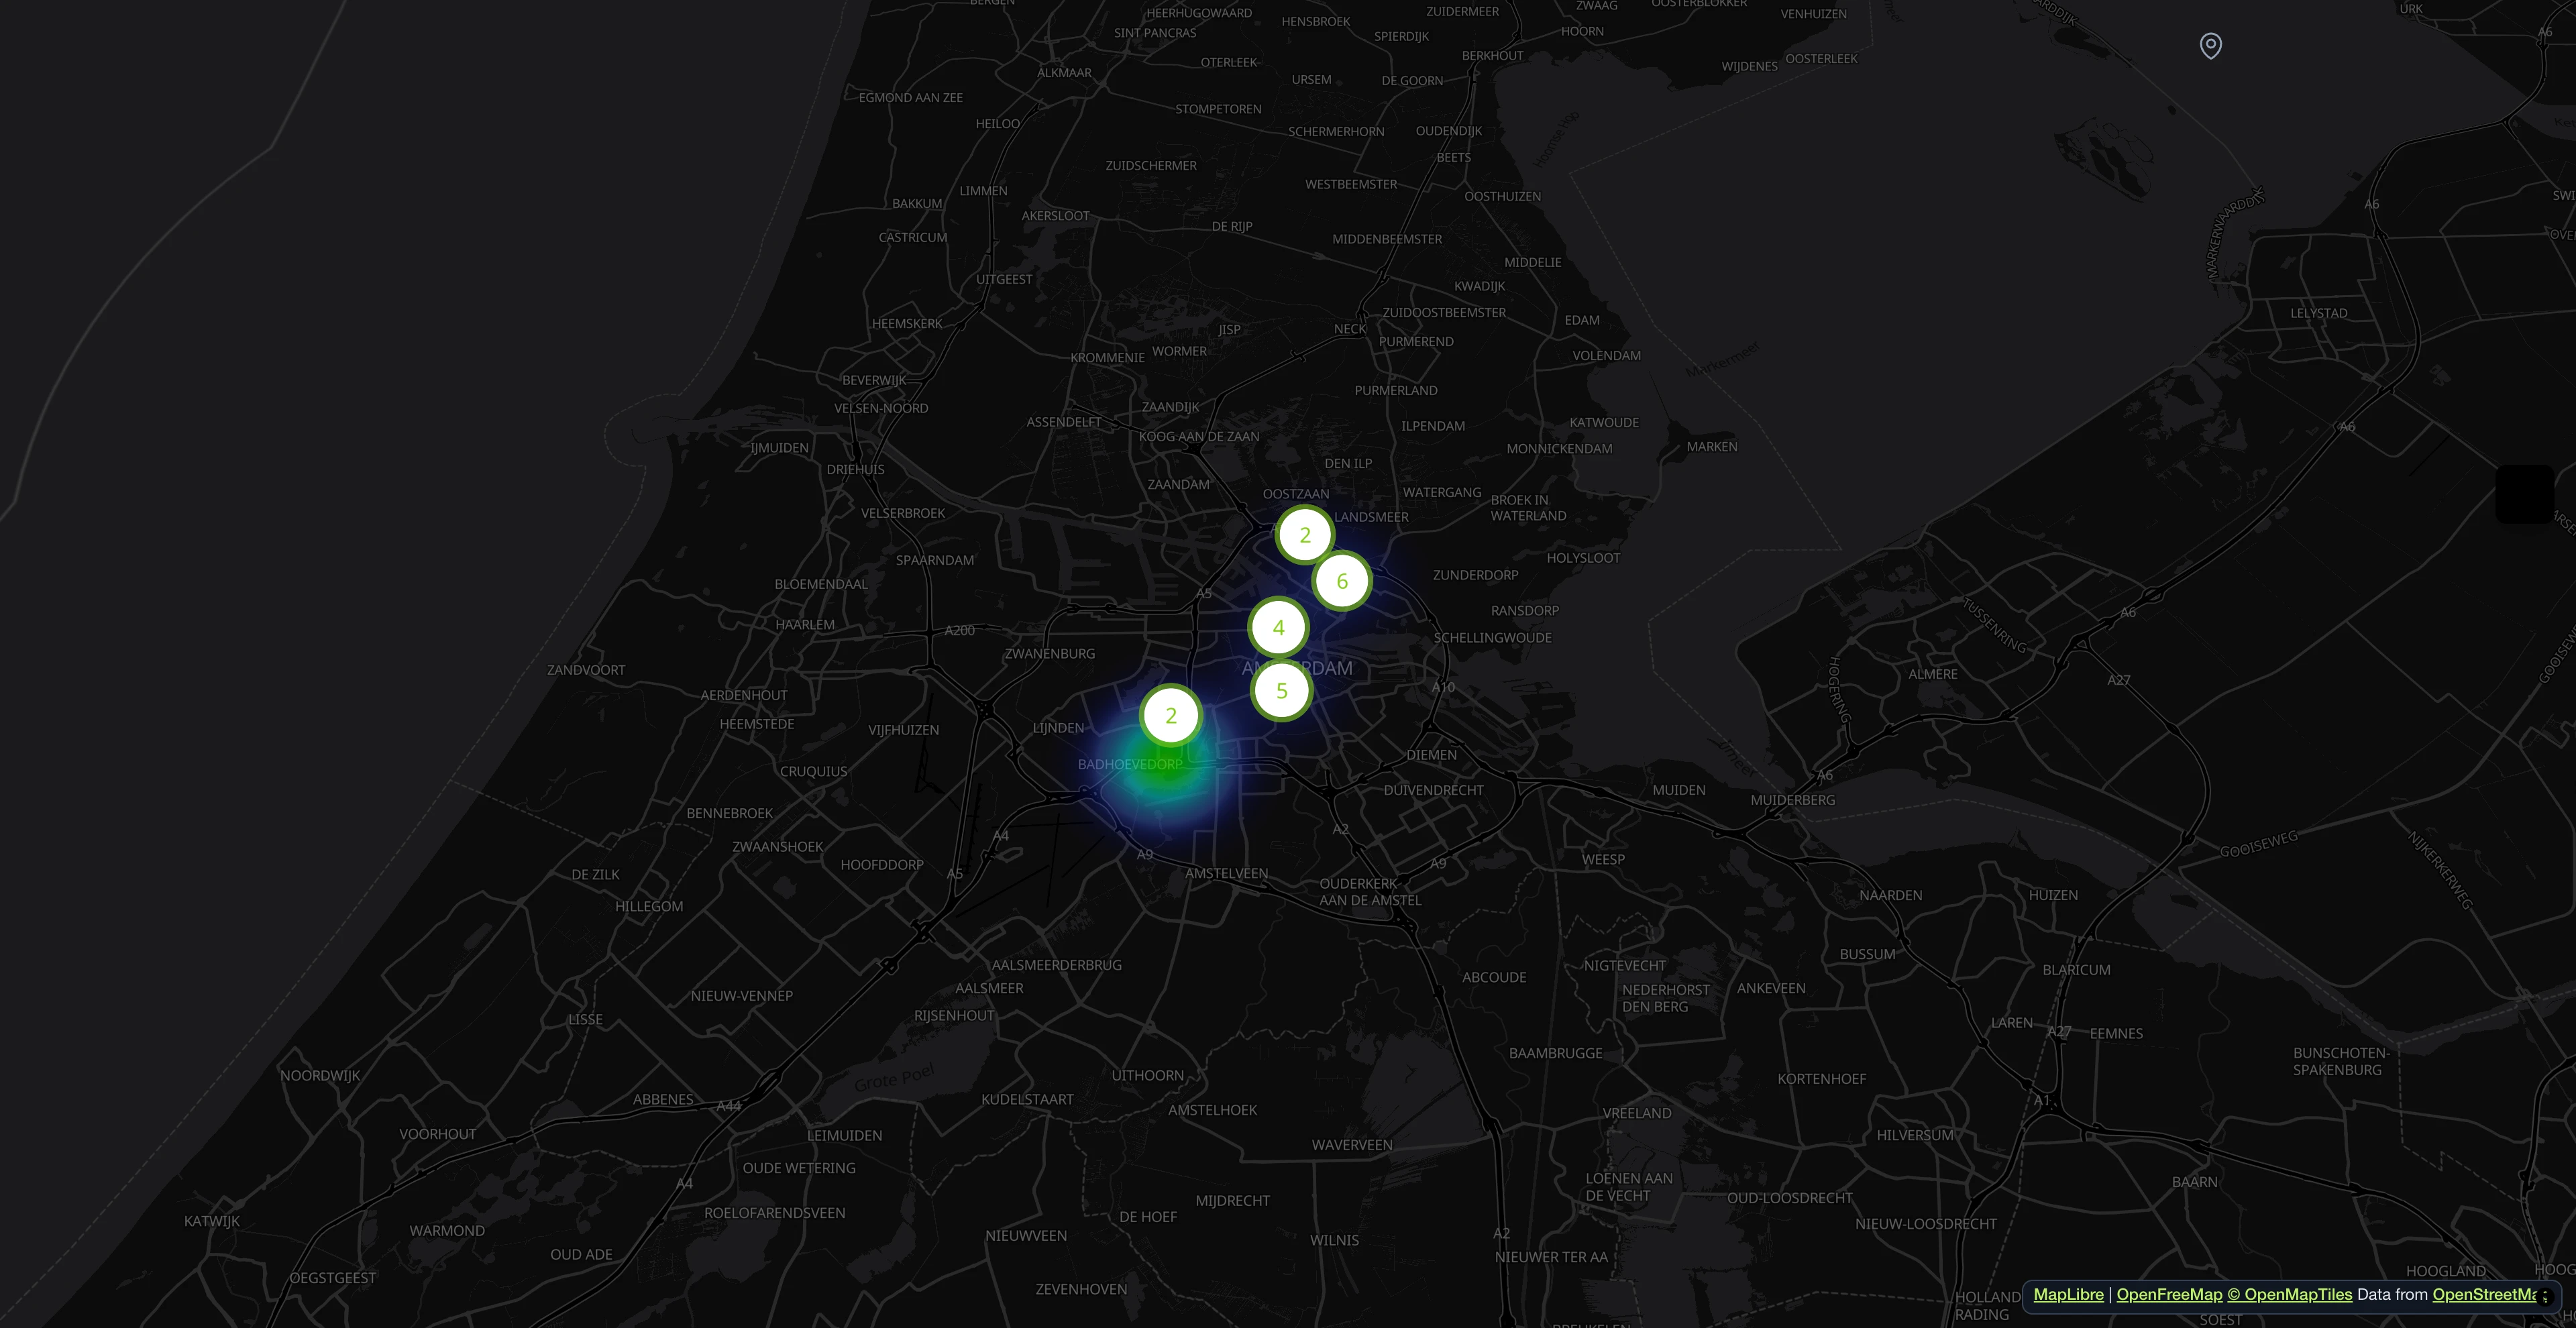
Contributors pin issues with photos and location. Markers cluster automatically and color-code by category.
Take a photo, AI does the rest
Citizens upload a photo. The AI identifies the category, drafts a description, and pre-fills attributes in real time. The reporter edits and sends.

Reports on an interactive map
Contributors pin issues with photos and location. Markers cluster automatically and color-code by category.

All reports at a glance
Search, filter, and sort all incoming reports. Assign departments, update statuses, and keep track of every issue from submission to resolution.

AI writes the report for you
Upload a photo, and the system generates a detailed description, extracts category attributes, and scores the hazard level. Edit before submitting.

AI-powered processing pipeline
Reports are indexed for duplicates, classified for hazard level, scored for sentiment, and auto-filled with category-specific attributes. All runs as a background batch.

Open311-compliant service catalog
Every category is served as an Open311 GeoReport v2 service with typed attributes, dropdown options and per-language labels. No vendor lock-in.

Everything in one dashboard
Track KPIs, manage reports, assign teams. AI analyzes photos for hazards and sentiment automatically.

- 1M+ reports since 2011
- Open Source
- Open311 GeoReport v2
- EU-hosted
Try it live:demo.mark-a-spot.com/amsterdam
Need facility management, custom WMS layers, structured data fields per workflow status, or multi-district and multi-city setups? Explore the full platform atmark-a-spot.com
Start your Accessibility Barrier Reporter
Describe your project and our AI will configure the perfect workspace for you.