Urban Climate Risk Map: Identify Heat Islands & Flood Risks
Monitor climate impacts like heat hotspots or flooding areas on a map.
Describe your project and we'll create a custom map for you.
What is an urban climate risk map?
Urban climate risk mapping documents how heat, flooding, and extreme weather affect specific locations in a city. Residents and local climate groups record heat islands, flood-prone intersections, drought damage, and storm water runoff on a shared map. Each observation carries a GPS location, photo, and category. The resulting dataset reveals climate risks block by block, not as abstract models but as documented conditions on the ground.
Contributors choose from predefined categories: heat hotspot, flood risk area, tree loss, drought damage, or soil erosion. A smartphone photo at the location is enough to start a record. Over time, seasonal patterns emerge: which streets flood every spring, where temperatures spike in summer, where tree canopy has disappeared. The data supplements official climate models with hyperlocal community observations.
Municipal climate adaptation teams, environmental NGOs, and urban planners use the collected data to prioritize investments in green infrastructure, drainage improvements, and shade planning. CivicSpot provides the platform, communities provide the observations. The Open311 API makes all data available for GIS analysis and policy reports.
Who is this for?
Communities
Resident groups, school parents, neighbourhood initiatives collecting local data.
Organizations
NGOs, nonprofits, and research teams running participatory mapping projects.
Municipalities
City administrations and public agencies managing citizen reports at scale.
Use Cases
For climate initiatives and environmental groups
Run neighborhood-level climate observation campaigns. Volunteers document heat hotspots, flooding, and tree loss. The data gives local groups concrete evidence for conversations with city administrations about climate adaptation measures.
For municipalities and climate adaptation teams
Receive structured, GPS-documented climate risk observations from residents. Identify which streets and intersections are most affected by heat or flooding. Use the data to prioritize green infrastructure investments and drainage improvements.
For urban planners and researchers
Access hyperlocal climate impact data collected over time. Filter by season, category, or area to analyze patterns. Export via Open311 API for GIS integration and research publications.
Categories included
Common issues reported include road damage, broken streetlights, illegal dumping, graffiti, and more. Each category can be customized from your dashboard after setup.
What you get
Heat Island Mapping
Contributors document urban heat hotspots: sun-exposed plazas, concrete surfaces without shade, and areas with missing tree cover. Clustered reports reveal the heat island pattern across the city.
Flood Risk Reporting
Residents report locations where water collects during heavy rain: underpasses, low-lying streets, clogged drains. The data builds a community-sourced flood risk map that supplements official models.
Urban Microclimate Data Collection
Observations cover drought damage, storm water runoff, tree loss, and soil erosion. Each report includes GPS location and photo. Over time the dataset captures how climate impacts play out block by block.
Seasonal Risk Tracking
Filter reports by date range to compare conditions across seasons and years. Recurring patterns, like annual flooding at the same intersection, become visible and support long-term adaptation planning.
See it in action
From data collection to insights
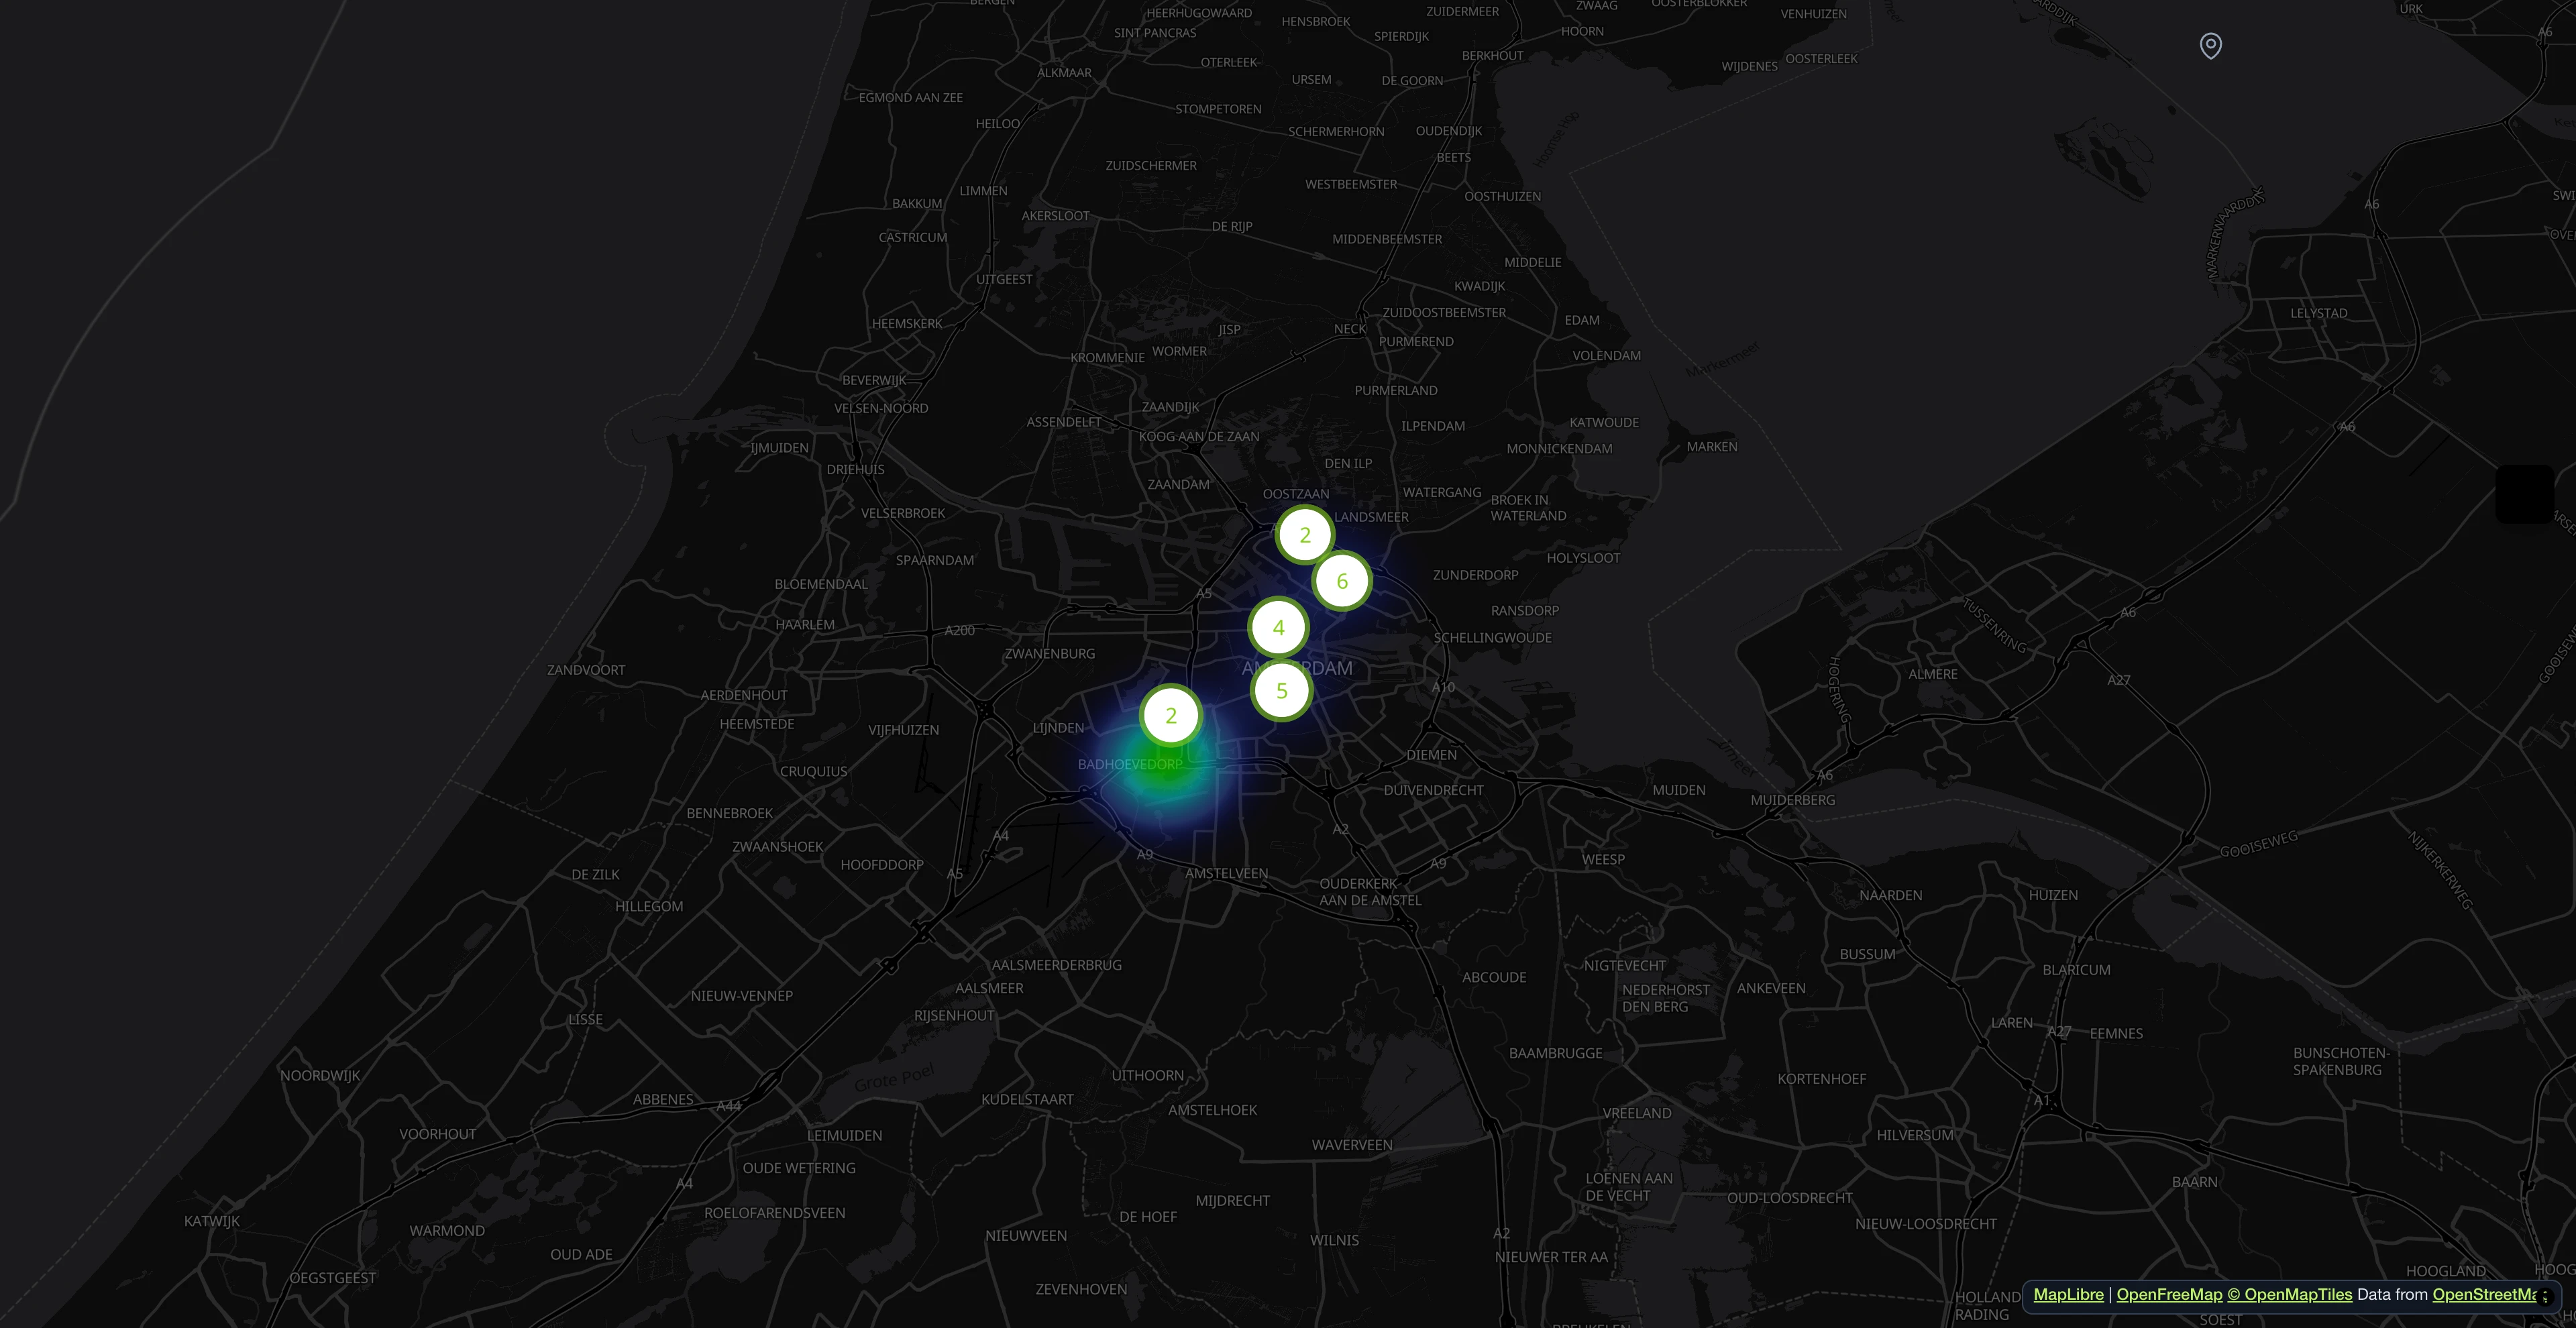
Contributors pin issues with photos and location. Markers cluster automatically and color-code by category.
Take a photo, AI does the rest
Citizens upload a photo. The AI identifies the category, drafts a description, and pre-fills attributes in real time. The reporter edits and sends.

Reports on an interactive map
Contributors pin issues with photos and location. Markers cluster automatically and color-code by category.

All reports at a glance
Search, filter, and sort all incoming reports. Assign departments, update statuses, and keep track of every issue from submission to resolution.

AI writes the report for you
Upload a photo, and the system generates a detailed description, extracts category attributes, and scores the hazard level. Edit before submitting.

AI-powered processing pipeline
Reports are indexed for duplicates, classified for hazard level, scored for sentiment, and auto-filled with category-specific attributes. All runs as a background batch.

Open311-compliant service catalog
Every category is served as an Open311 GeoReport v2 service with typed attributes, dropdown options and per-language labels. No vendor lock-in.

Everything in one dashboard
Track KPIs, manage reports, assign teams. AI analyzes photos for hazards and sentiment automatically.

- 1M+ reports since 2011
- Open Source
- Open311 GeoReport v2
- EU-hosted
Try it live:demo.mark-a-spot.com/amsterdam
Need facility management, custom WMS layers, structured data fields per workflow status, or multi-district and multi-city setups? Explore the full platform atmark-a-spot.com
Start your Urban Climate Risk Map
Describe your project and our AI will configure the perfect workspace for you.