Map Wildlife & Nature Observations: Citizen Science Data Collection
Collect nature observations such as wildlife sightings, nesting sites, or invasive species reports.
Describe your project and we'll create a custom map for you.
What is Wildlife & Nature Observations Map?
People record wildlife sightings, nesting sites, and environmental changes directly on a map. Nature observation and wildlife mapping turn everyday sightings into usable biodiversity data. Volunteers and citizen scientists document what they see in the field: a rare amphibian at a known crossing, an invasive plant species spreading along a riverbank, a nesting site in a protected area. Each record carries a GPS location, timestamp, and photo. The data accumulates into a spatial dataset that reflects actual conditions on the ground.
Contributors categorize each observation by type: wildlife sighting, nesting site, invasive species, roadkill, habitat change, or habitat damage. A photo taken on a smartphone is enough to start a record. Species identification, habitat notes, and additional observations can be added in the field or later. Seasonal patterns become visible as the dataset grows. Researchers can filter by category, date range, or geographic area to extract what they need.
Conservation organizations, university research groups, and environmental authorities use the collected data for habitat assessments, migration corridor analysis, and species distribution monitoring. NABU, BUND, and comparable nature protection groups run ongoing observation campaigns with volunteer networks. The Open311 API and dashboard export make the data available for GIS workflows and research publications without manual effort.
Who is this for?
Communities
Resident groups, school parents, neighbourhood initiatives collecting local data.
Organizations
NGOs, nonprofits, and research teams running participatory mapping projects.
Municipalities
City administrations and public agencies managing citizen reports at scale.
Use Cases
For nature conservation groups and citizen science
Run observation campaigns with volunteer networks. NABU, BUND, and similar organizations collect species data across large areas without field staff at every location. Volunteers contribute from the field, coordinators review from the dashboard.
For researchers and universities
Build a georeferenced dataset for habitat assessments, migration corridor studies, and species distribution models. API access and CSV export fit directly into existing GIS and statistical workflows.
For environmental authorities and national parks
Monitor protected areas with structured, photo-documented data. Track invasive species spread, identify habitat damage early, and document amphibian crossing activity for infrastructure planning decisions.
Categories included
Common issues reported include road damage, broken streetlights, illegal dumping, graffiti, and more. Each category can be customized from your dashboard after setup.
What you get
Species Observation Categories
Pre-configured categories for wildlife sightings, nesting sites, invasive species, roadkill, habitat change, and habitat damage. Add custom categories for project-specific needs.
Habitat Documentation
Each record captures GPS location, photo, and category. Contributors add habitat notes, species names, and condition details directly in the field or from a desktop.
Seasonal Pattern Analysis
Filter observations by date range to detect migration timing, breeding seasons, and year-over-year changes in species distribution. The map shows density clusters over time.
Research Data Export
All observations are available via the dashboard and the Open311 API. Export to CSV or GeoJSON for GIS analysis, species reports, and research publications.
See it in action
From data collection to insights
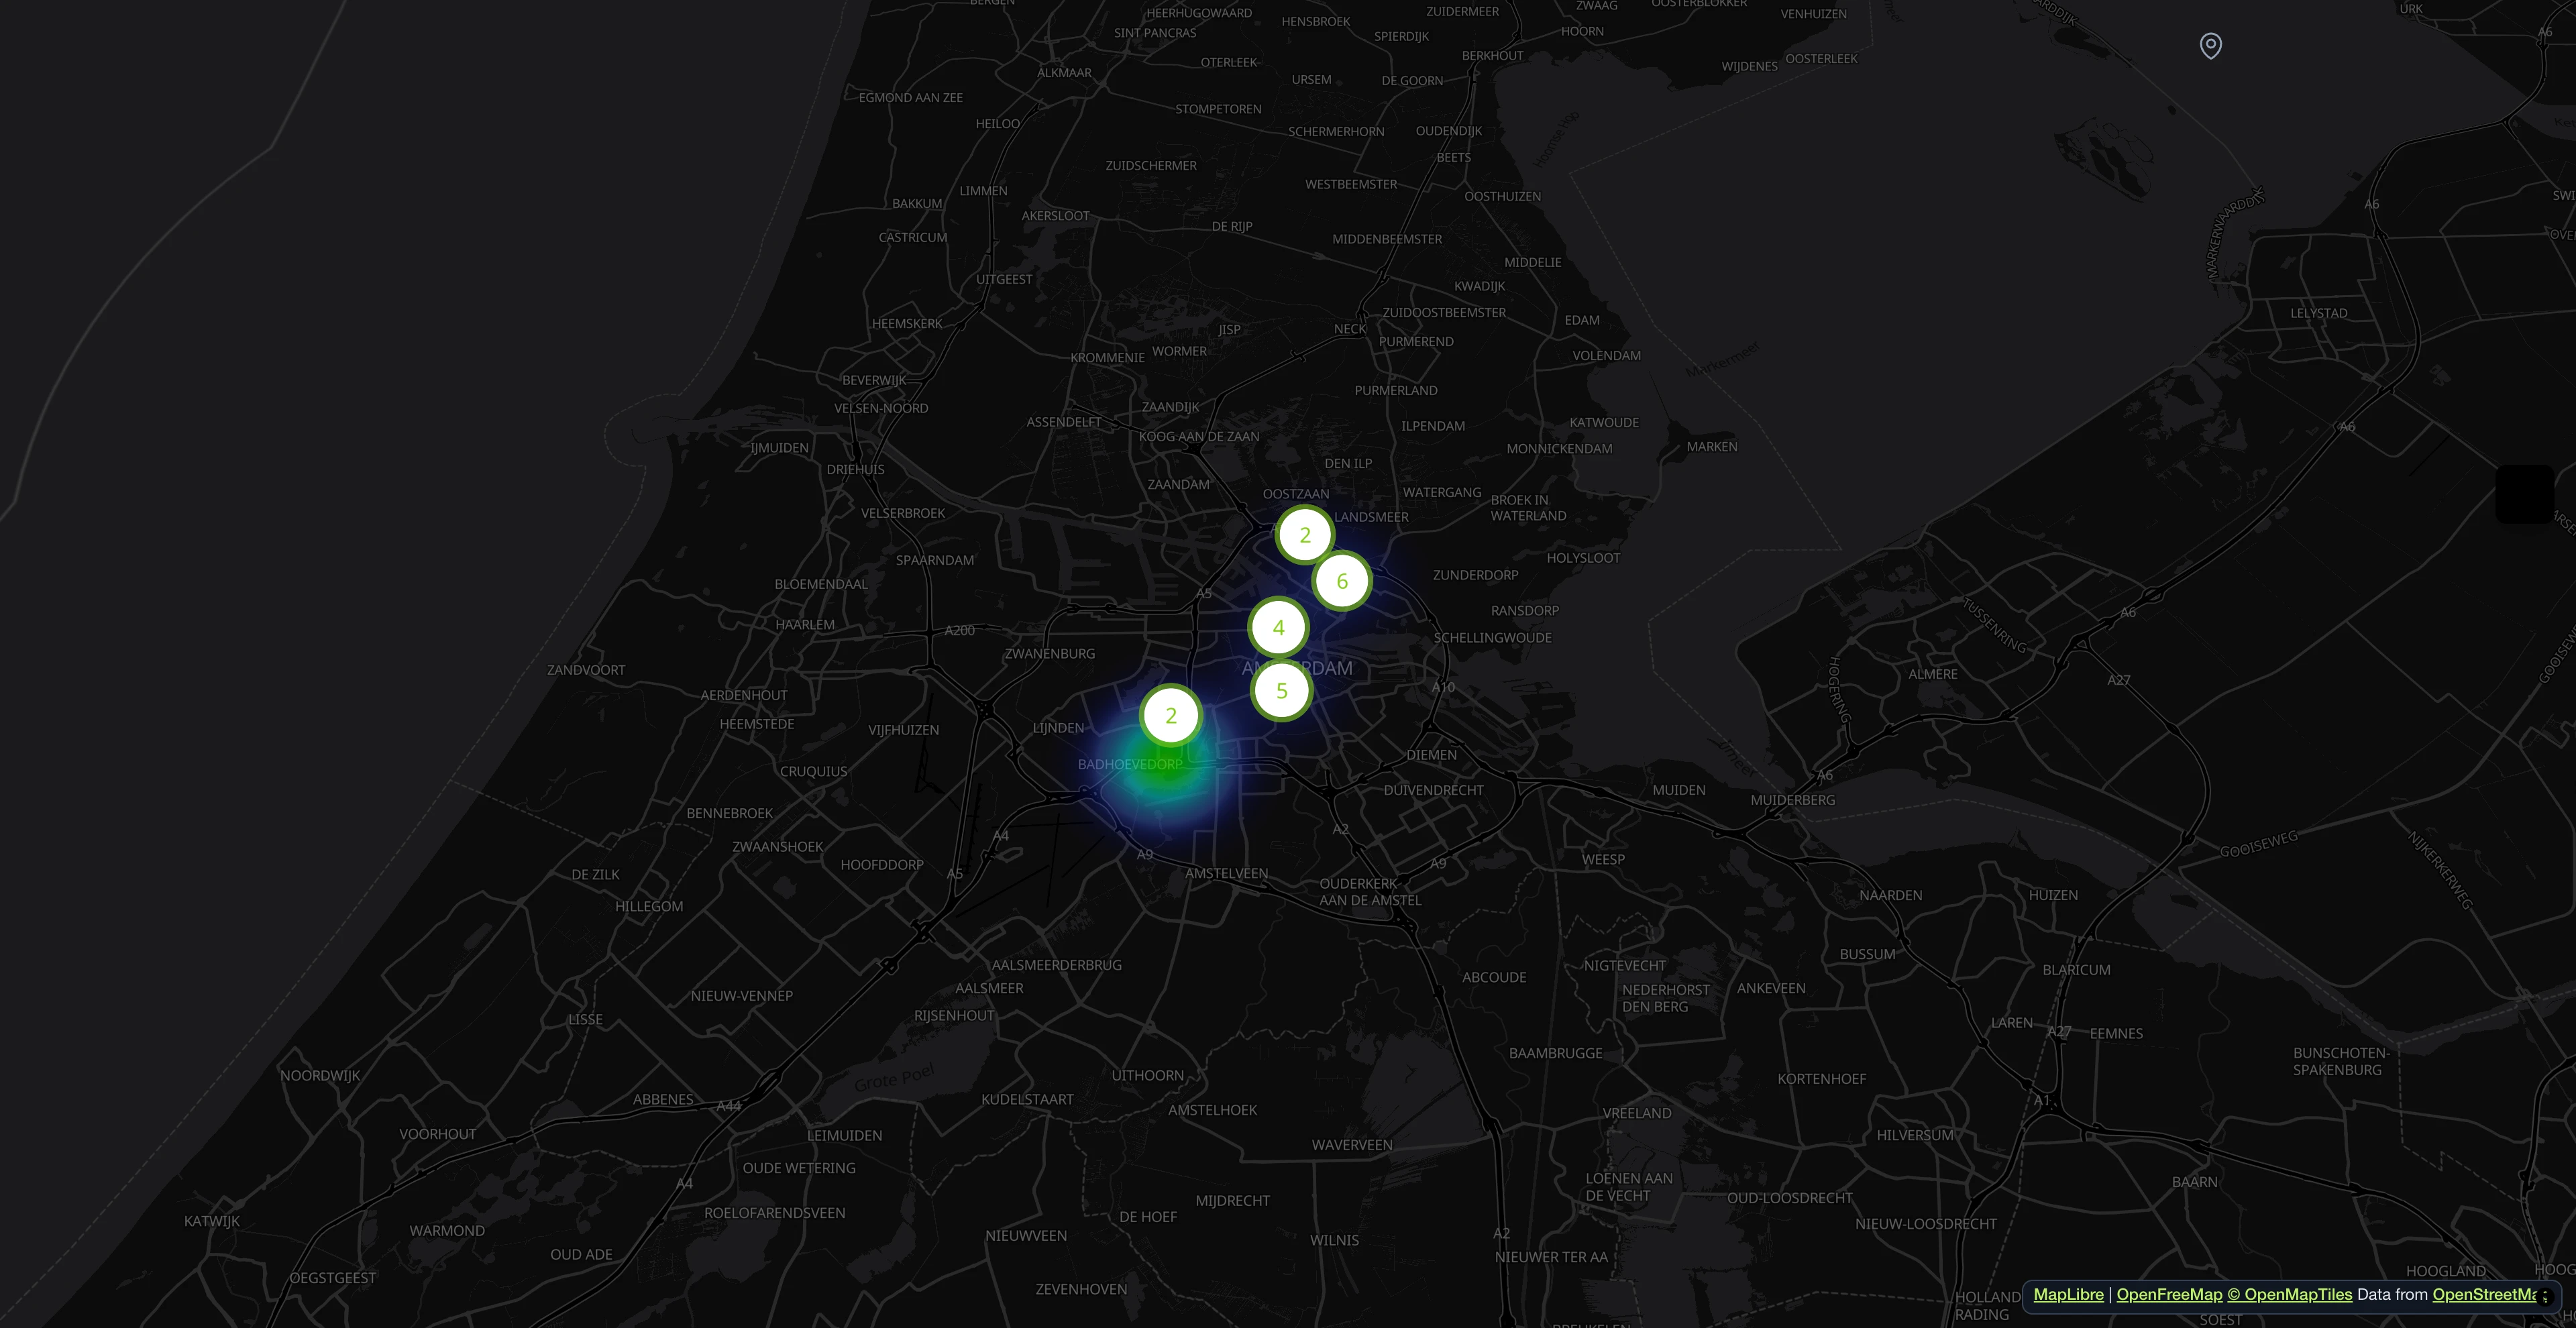
Contributors pin issues with photos and location. Markers cluster automatically and color-code by category.
Reports on an interactive map
Contributors pin issues with photos and location. Markers cluster automatically and color-code by category.

Everything in one dashboard
Track KPIs, manage reports, assign teams. AI analyzes photos for hazards and sentiment automatically.

All reports at a glance
Search, filter, and sort all incoming reports. Assign departments, update statuses, and keep track of every issue from submission to resolution.

AI-powered processing
Photos are analyzed automatically: category detection, hazard scoring, sentiment analysis. Save hours of manual triage.

Street-level detail
Zoom into individual reports with precise locations. Each marker tells the full story with photos, status, and timeline.
Start your Wildlife & Nature Observations Map
Describe your project and our AI will configure the perfect workspace for you.