Crisis Mapping Tool: Real-Time Disaster Reporting for Communities
Map disasters and emergency situations such as floods, damage and road blockages.
Popište svůj projekt a vytvoříme pro vás vlastní mapu.
Co je CrisisMap?
Crisis mapping software enables real-time disaster reporting during floods, storms, wildfires, and other emergencies. With CivicSpot's crisis mapping tool, anyone can document flooding, building damage, power outages, and road blockages on a shared map. Emergency managers, first responders, and relief organizations see the full picture as it unfolds.
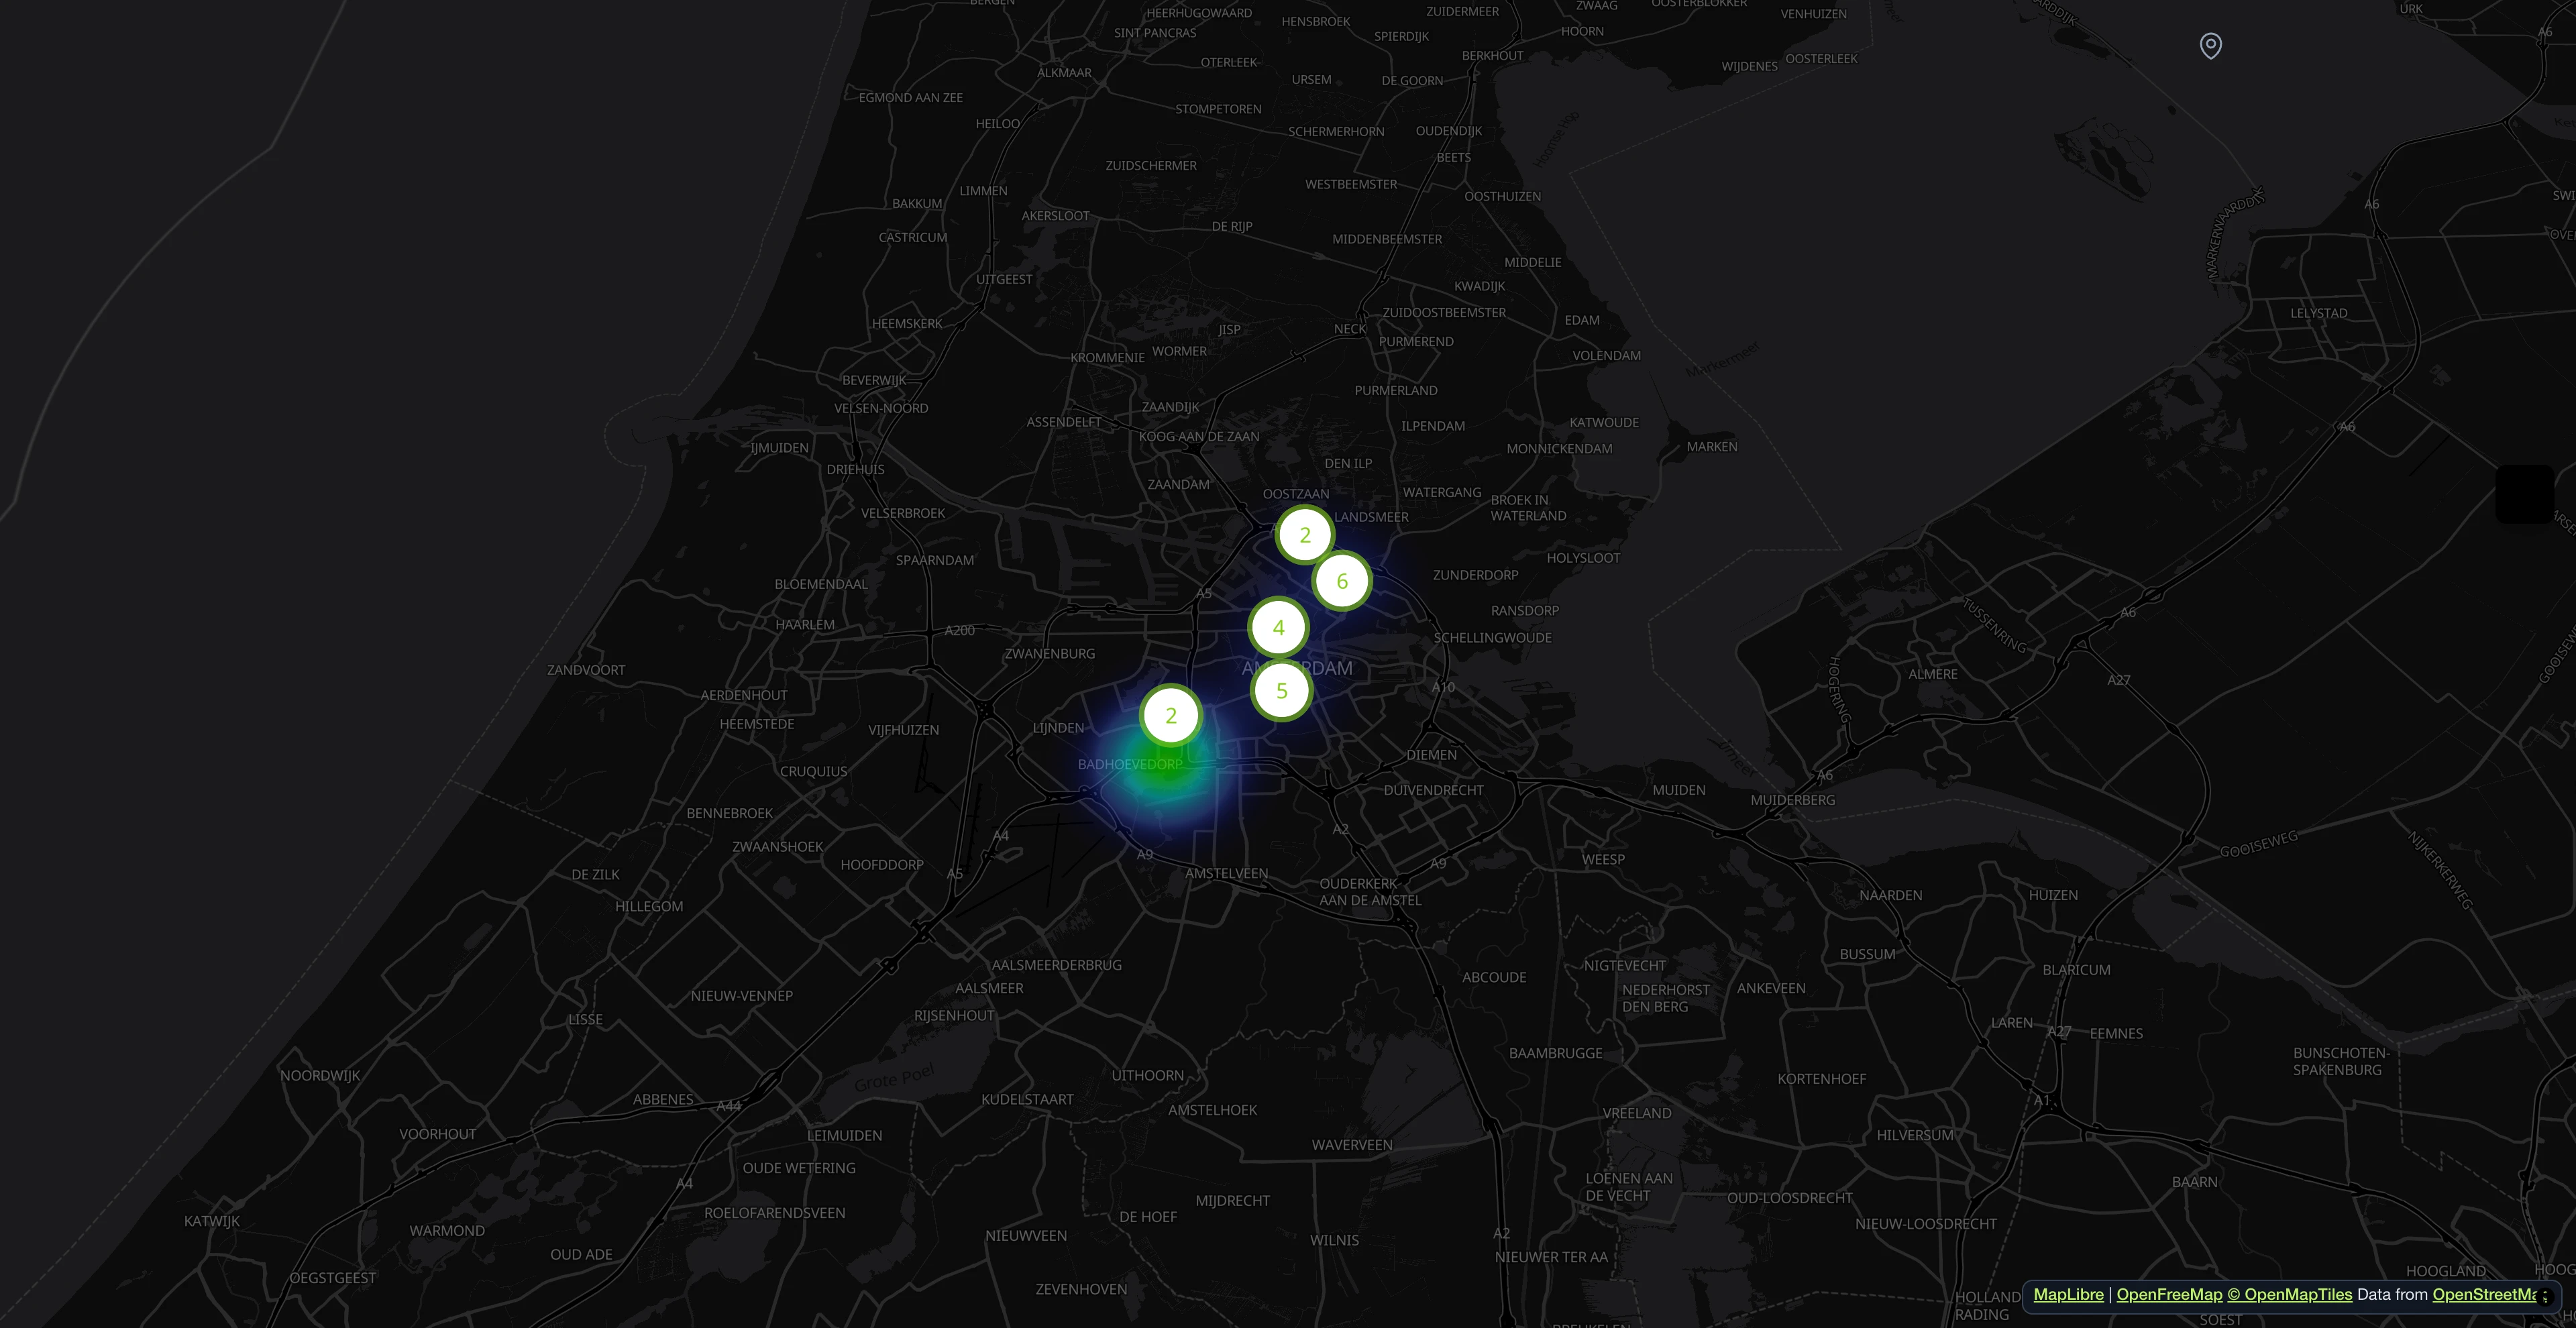
Reports come in with photos, GPS locations, and timestamps. Teams see where flooding has reached, which roads are impassable, where people need help, and where aid is already available. The real-time disaster map updates as new reports arrive, giving coordinators a live operational picture without phone calls or spreadsheets.
The crisis mapping tool is used by NGOs, community organizations, municipal emergency services, and international relief operations. It works in low-connectivity environments, supports anonymous reporting for sensitive situations, and scales from a neighborhood flood to a regional disaster. AI-powered hazard detection flags critical reports automatically.
Pro koho to je?
Komunity
Skupiny obyvatel, rodiče školáků a sousedské iniciativy sbírající místní data.
Organizace
Neziskové organizace, spolky a výzkumné týmy realizující participativní mapování.
Obce
Městské správy a veřejné instituce spravující občanská hlášení ve větším měřítku.
Použití
For emergency services
Get a real-time operational picture during floods, storms, or wildfires. See where reports cluster and where aid is needed most.
For NGOs and relief organizations
Coordinate disaster response across teams. Volunteers report from the ground, coordinators manage from the dashboard.
For communities
Neighbours help neighbours. Document damage, share aid offers, report blocked roads. No training needed.
Zahrnuté kategorie
Mezi běžná hlášení patří poškození silnic, rozbité lampy, nelegální skládky, graffiti a další. Každou kategorii lze po nastavení upravit v dashboardu.
Co získáte
Real-Time Updates
Every new report appears on the map immediately. Coordinators see the disaster as it unfolds, not hours later.
Anonymous Reporting
People in sensitive situations can submit reports without creating an account. No barriers to critical information.
Emergency Categories
Pre-configured categories for flooding, building damage, power outages, road blocks, missing persons, and aid offers.
AI Hazard Detection
Uploaded photos are analyzed automatically for severity and safety risks. Critical reports get flagged so responders prioritize correctly.
Podívejte se v praxi
Od sběru dat k poznatkům
Přispěvatelé označují problémy fotografiemi a polohou. Značky se automaticky seskupují a barevně odlišují podle kategorie.
Vyfoťte problém, AI udělá zbytek
Občané nahrají fotografii. AI rozpozná kategorii, navrhne popis a v reálném čase předvyplní atributy. Hlásící text upraví a odešle.

Hlášení na interaktivní mapě
Přispěvatelé označují problémy fotografiemi a polohou. Značky se automaticky seskupují a barevně odlišují podle kategorie.

Všechna hlášení na první pohled
Vyhledávejte, filtrujte a řaďte všechna příchozí hlášení. Přiřazujte oddělení, aktualizujte stavy a sledujte každý problém od odeslání po vyřešení.

AI napíše hlášení za vás
Nahrajte fotografii a systém vygeneruje podrobný popis, extrahuje atributy kategorie a ohodnotí úroveň rizika. Před odesláním můžete vše upravit.

Zpracování s podporou AI
Hlášení se indexují kvůli duplicitám, klasifikují podle úrovně rizika, hodnotí podle sentimentu a automaticky doplňují atributy specifické pro kategorii. Vše běží jako úloha na pozadí.

Katalog služeb kompatibilní s Open311
Každá kategorie je poskytována jako služba Open311 GeoReport v2 s typovanými atributy, rozbalovacími volbami a vícejazyčnými popisky. Bez vendor lock-in.

Vše v jednom dashboardu
Sledujte KPI, spravujte hlášení, přiřazujte týmy. AI automaticky analyzuje fotografie z hlediska rizik a sentimentu.

- 1M+ hlášení od roku 2011
- Open Source
- Open311 GeoReport v2
- Hostováno v EU
Vyzkoušet živě:demo.mark-a-spot.com/amsterdam
Potřebuješ správu budov, vlastní WMS vrstvy, strukturovaná datová pole pro každý stav workflow nebo nastavení pro více obvodů a měst? Prozkoumej celou platformu namark-a-spot.com
Začněte hned: CrisisMap
Popište svůj projekt a naše AI pro vás nakonfiguruje vhodný pracovní prostor.