Urban Climate Risk Map: Identify Heat Islands & Flood Risks
Monitor climate impacts like heat hotspots or flooding areas on a map.
Popište svůj projekt a vytvoříme pro vás vlastní mapu.
Co je Urban Climate Risk Map?
Urban climate risk mapping documents how heat, flooding, and extreme weather affect specific locations in a city. Residents and local climate groups record heat islands, flood-prone intersections, drought damage, and storm water runoff on a shared map. Each observation carries a GPS location, photo, and category. The resulting dataset reveals climate risks block by block, not as abstract models but as documented conditions on the ground.
Contributors choose from predefined categories: heat hotspot, flood risk area, tree loss, drought damage, or soil erosion. A smartphone photo at the location is enough to start a record. Over time, seasonal patterns emerge: which streets flood every spring, where temperatures spike in summer, where tree canopy has disappeared. The data supplements official climate models with hyperlocal community observations.
Municipal climate adaptation teams, environmental NGOs, and urban planners use the collected data to prioritize investments in green infrastructure, drainage improvements, and shade planning. CivicSpot provides the platform, communities provide the observations. The Open311 API makes all data available for GIS analysis and policy reports.
Pro koho to je?
Komunity
Skupiny obyvatel, rodiče školáků a sousedské iniciativy sbírající místní data.
Organizace
Neziskové organizace, spolky a výzkumné týmy realizující participativní mapování.
Obce
Městské správy a veřejné instituce spravující občanská hlášení ve větším měřítku.
Použití
For climate initiatives and environmental groups
Run neighborhood-level climate observation campaigns. Volunteers document heat hotspots, flooding, and tree loss. The data gives local groups concrete evidence for conversations with city administrations about climate adaptation measures.
For municipalities and climate adaptation teams
Receive structured, GPS-documented climate risk observations from residents. Identify which streets and intersections are most affected by heat or flooding. Use the data to prioritize green infrastructure investments and drainage improvements.
For urban planners and researchers
Access hyperlocal climate impact data collected over time. Filter by season, category, or area to analyze patterns. Export via Open311 API for GIS integration and research publications.
Zahrnuté kategorie
Mezi běžná hlášení patří poškození silnic, rozbité lampy, nelegální skládky, graffiti a další. Každou kategorii lze po nastavení upravit v dashboardu.
Co získáte
Heat Island Mapping
Contributors document urban heat hotspots: sun-exposed plazas, concrete surfaces without shade, and areas with missing tree cover. Clustered reports reveal the heat island pattern across the city.
Flood Risk Reporting
Residents report locations where water collects during heavy rain: underpasses, low-lying streets, clogged drains. The data builds a community-sourced flood risk map that supplements official models.
Urban Microclimate Data Collection
Observations cover drought damage, storm water runoff, tree loss, and soil erosion. Each report includes GPS location and photo. Over time the dataset captures how climate impacts play out block by block.
Seasonal Risk Tracking
Filter reports by date range to compare conditions across seasons and years. Recurring patterns, like annual flooding at the same intersection, become visible and support long-term adaptation planning.
Podívejte se v praxi
Od sběru dat k poznatkům
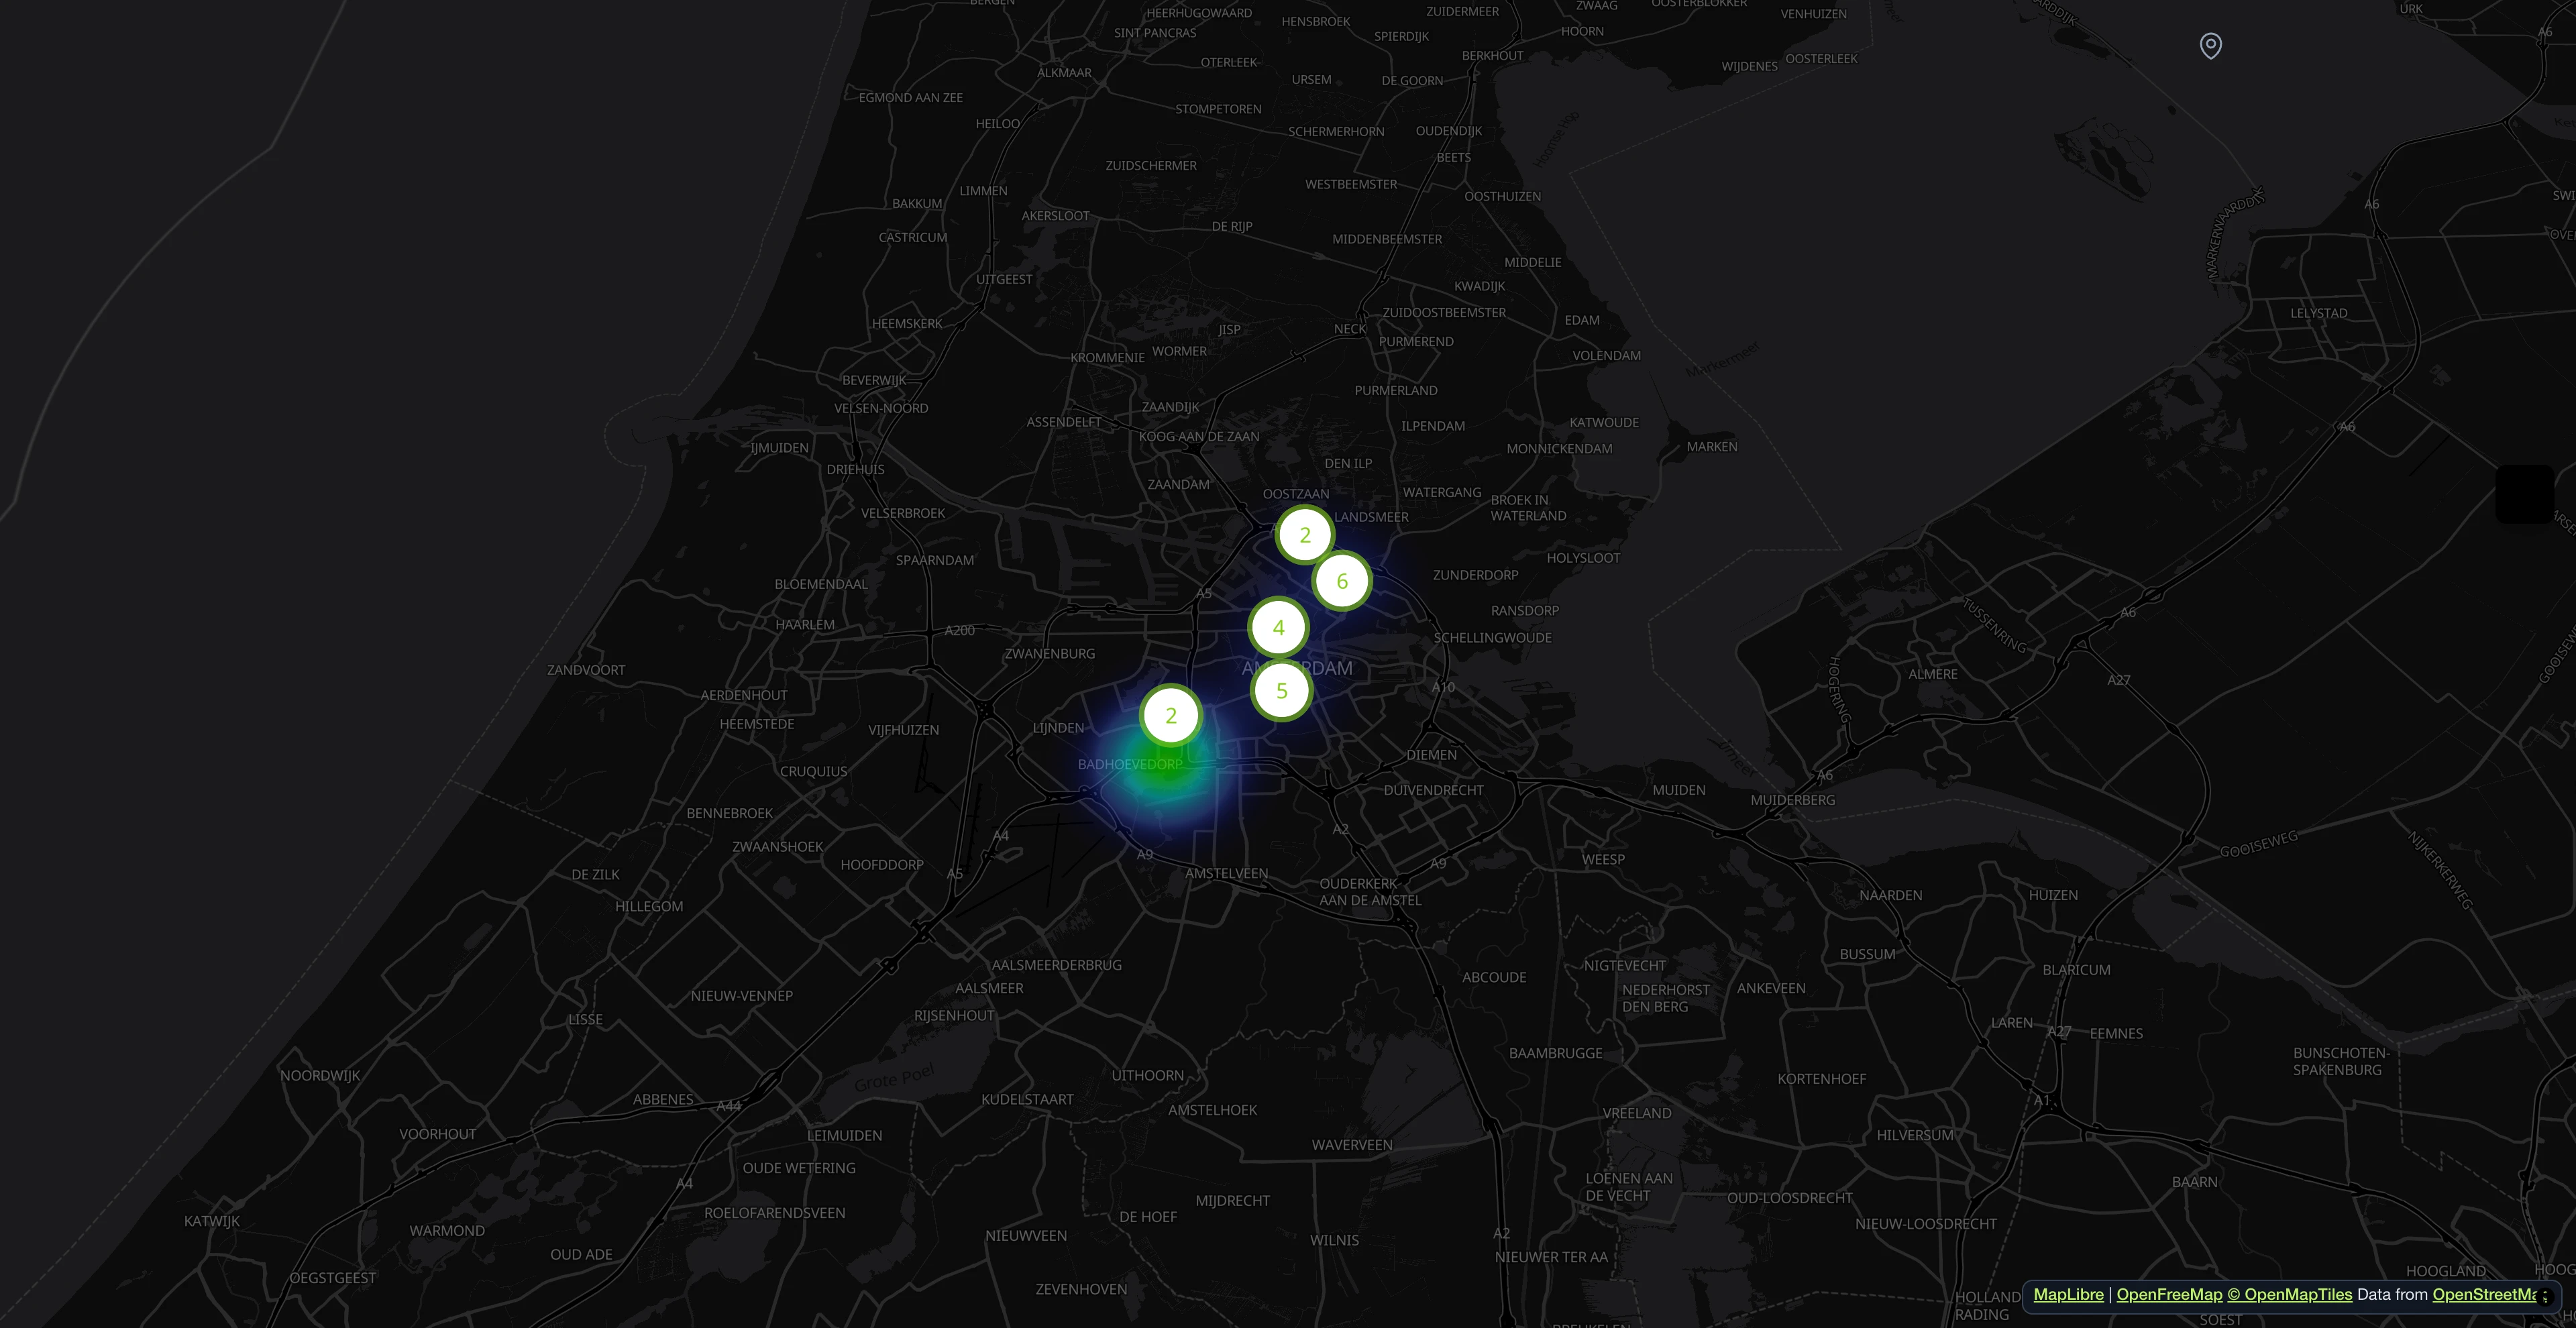
Přispěvatelé označují problémy fotografiemi a polohou. Značky se automaticky seskupují a barevně odlišují podle kategorie.
Vyfoťte problém, AI udělá zbytek
Občané nahrají fotografii. AI rozpozná kategorii, navrhne popis a v reálném čase předvyplní atributy. Hlásící text upraví a odešle.

Hlášení na interaktivní mapě
Přispěvatelé označují problémy fotografiemi a polohou. Značky se automaticky seskupují a barevně odlišují podle kategorie.

Všechna hlášení na první pohled
Vyhledávejte, filtrujte a řaďte všechna příchozí hlášení. Přiřazujte oddělení, aktualizujte stavy a sledujte každý problém od odeslání po vyřešení.

AI napíše hlášení za vás
Nahrajte fotografii a systém vygeneruje podrobný popis, extrahuje atributy kategorie a ohodnotí úroveň rizika. Před odesláním můžete vše upravit.

Zpracování s podporou AI
Hlášení se indexují kvůli duplicitám, klasifikují podle úrovně rizika, hodnotí podle sentimentu a automaticky doplňují atributy specifické pro kategorii. Vše běží jako úloha na pozadí.

Katalog služeb kompatibilní s Open311
Každá kategorie je poskytována jako služba Open311 GeoReport v2 s typovanými atributy, rozbalovacími volbami a vícejazyčnými popisky. Bez vendor lock-in.

Vše v jednom dashboardu
Sledujte KPI, spravujte hlášení, přiřazujte týmy. AI automaticky analyzuje fotografie z hlediska rizik a sentimentu.

- 1M+ hlášení od roku 2011
- Open Source
- Open311 GeoReport v2
- Hostováno v EU
Vyzkoušet živě:demo.mark-a-spot.com/amsterdam
Potřebuješ správu budov, vlastní WMS vrstvy, strukturovaná datová pole pro každý stav workflow nebo nastavení pro více obvodů a měst? Prozkoumej celou platformu namark-a-spot.com
Začněte hned: Urban Climate Risk Map
Popište svůj projekt a naše AI pro vás nakonfiguruje vhodný pracovní prostor.