
Veldgegevens verzamelplatform: onderzoek en citizen science
Verzamel georefereerde waarnemingen voor onderzoek en veldstudies.
Bekijk het in actie
Van dataverzameling tot inzichten
Mensen melden problemen, verzamelen ideeën en brengen belangrijke plekken in kaart, telkens met foto en locatie.
De afbeeldingen tonen een meldingenkaart als voorbeeld. Voor je eigen onderzoek bepaal je zelf de categorieën en kenmerken.
Maak een foto, de AI stelt categorie en tekst voor
Iemand uploadt een foto. De AI stelt categorie, beschrijving en kenmerken voor. Die persoon controleert, past aan waar nodig en verstuurt.

Meldingen op een interactieve kaart
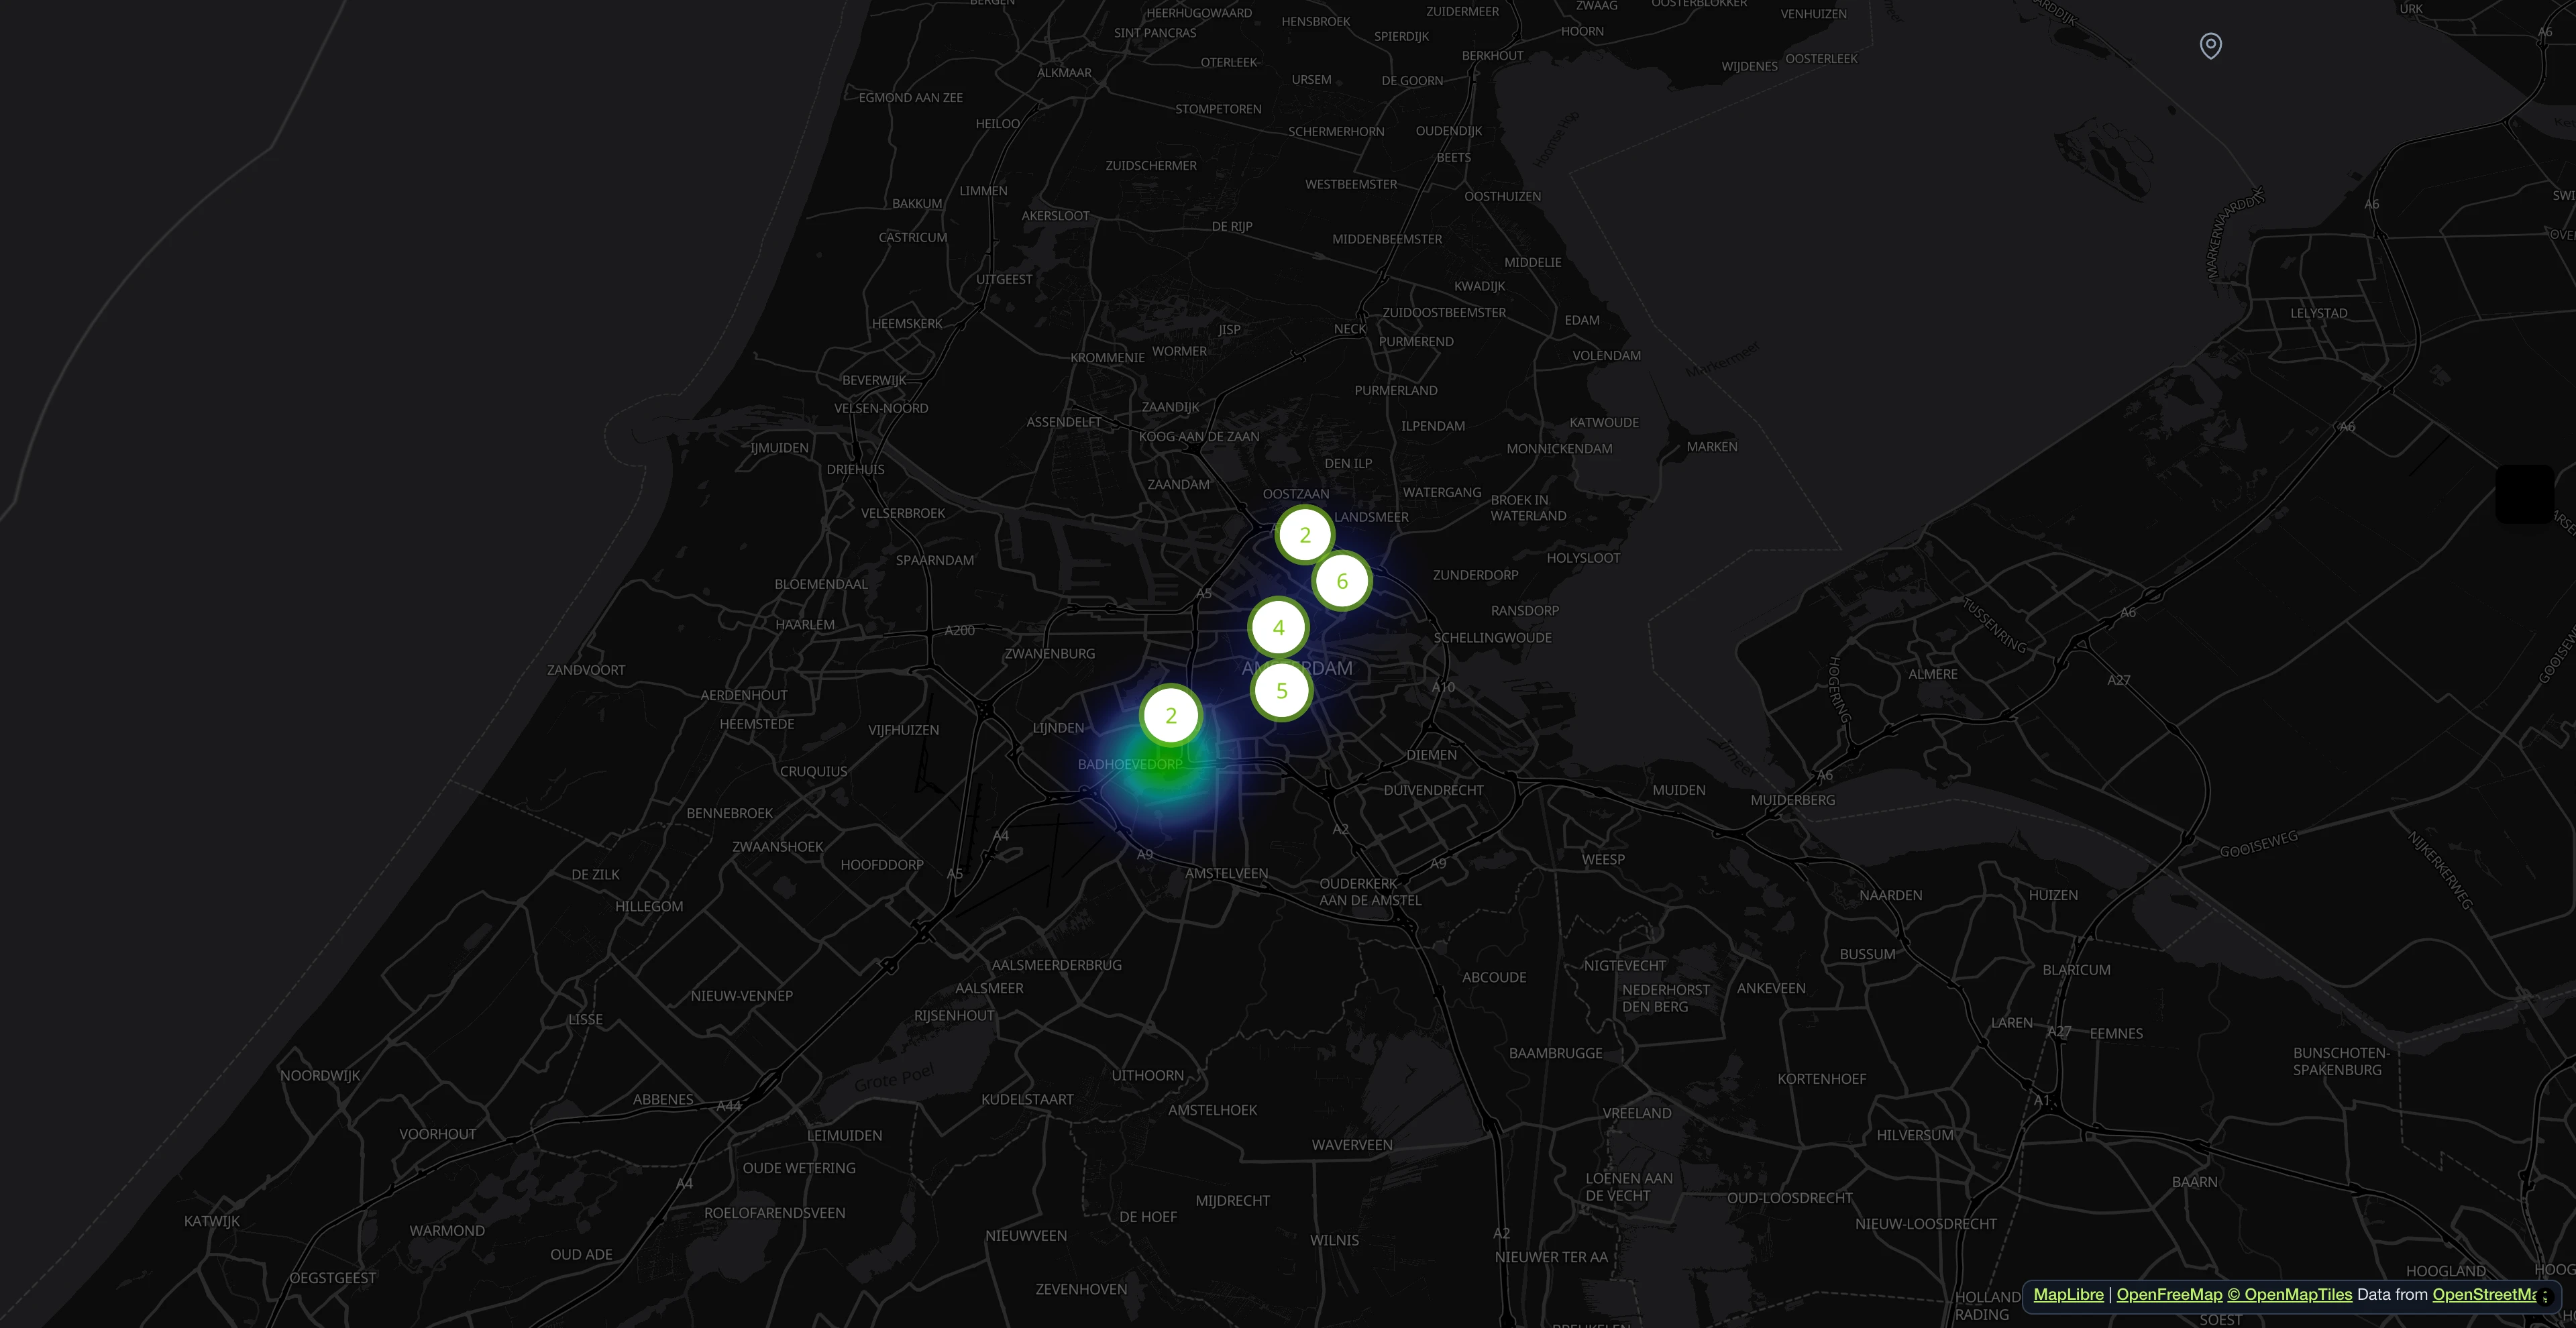
Mensen melden problemen met een foto en een locatie. Op de kaart zie je meteen waar meldingen zich opstapelen.

Alle meldingen in één oogopslag
Zoek, filter en sorteer alle binnenkomende meldingen. Wijs afdelingen toe, werk statussen bij en volg elk probleem van melding tot oplossing.

Elke melding met beschrijving en kenmerken
De foto levert voorstellen voor beschrijving, kenmerken en gevarenniveau. Voor het versturen is alles aan te passen.

AI-gestuurde verwerkingspipeline
Dubbele meldingen worden herkend, gevaren ingeschat en velden vooraf ingevuld. Dat gebeurt op de achtergrond.

Open311-conform servicecatalogus
Elke categorie wordt geleverd als een Open311 GeoReport v2-service met getypte attributen, dropdown-opties en meertalige labels. Geen vendor lock-in.

Alles in één dashboard
Kerncijfers, verantwoordelijkheden en statussen op één plek. De AI markeert gevaren op foto's.

- Meer dan 1 miljoen meldingen sinds 2011
- Open Source
- Open311 GeoReport v2
- Gehost in de EU
Probeer het live:demo.mark-a-spot.com/amsterdam
Heb je facility management, eigen WMS-lagen, gestructureerde gegevensvelden per workflowstatus of multidistrict- en multistad-opstellingen nodig? Ontdek het volledige platform opmark-a-spot.com
Wat is een tool voor onderzoek en veldgegevensverzameling?
Field data collection with Mark-a-Spot works on any smartphone or tablet. Research teams define their observation categories, each with custom attributes (species name, condition rating, sample type, or whatever the study requires). Contributors open the map, drop a pin at their location, take a photo, fill in the attributes, and submit. The record carries GPS coordinates from the device, a timestamp, and the photo with its EXIF metadata.
Professional researchers use FieldResearch for structured surveys: biodiversity monitoring across transects, archaeological site inventories, tree health assessments, environmental damage mapping after storms or floods. Citizen science projects use the same tool to mobilize volunteers at scale. A university publishes the map link, participants contribute observations from the field, and the dataset grows without hiring additional staff.
Every observation is accessible through the Open311 API, the same open standard used by cities worldwide. Filter by category, date range, or bounding box. Export to CSV for spreadsheets and GIS import via its coordinate columns, or consume the JSON API directly from R, Python, or any analysis pipeline. The dashboard provides visual summaries and direct download.
Data ownership stays with the project. The platform runs on open standards, so data is never locked in. Multi-language support covers 18 languages, making it suitable for international research collaborations. Photo documentation with GPS metadata provides verifiable evidence chains for regulatory compliance, academic publications, and long-term monitoring programs.
- Custom Attributes per Category
- Each observation category (Service Definition) carries its own attribute set: species name, condition rating, sample type, material, or any field your study needs. Configured in the admin panel, no code changes required.
- GPS Photo Documentation
- Every record includes a photo with GPS coordinates and EXIF metadata from the device. The combination of visual evidence and precise location creates a verifiable record chain for publications and regulatory compliance.
- Open311 API Export
- All data is accessible through the Open311 API. Filter by category, date, or bounding box. Use the JSON API from R, Python, or any analysis pipeline, or export CSV with coordinates for QGIS and ArcGIS.
- Multi-language Support
- The platform supports 18 languages, making it suitable for international research collaborations and cross-border citizen science projects. Categories and attributes can be localized.
Voor wie is dit?
Universitaire onderzoeksprojecten
Bouw georefereerde datasets voor veldstudies met aangepaste kenmerken en gestructureerde export.
Milieuagentschappen en monitoring
Documenteer milieucondities met tijdgestempelde, fotogeverifieerde registraties.
Archeologische velddocumentatie
Registreer vondsten met precieze GPS-coördinaten, foto's en configureerbare kenmerken.
Citizen science
Betrek vrijwilligers bij dataverzameling op grote schaal. Deel een kaartlink en deelnemers dragen bij vanaf elke smartphone.
Inbegrepen categorieën
Deze categorieën horen bij het sjabloon. Na de installatie kun je ze in je dashboard hernoemen, aanvullen of verwijderen.
- Biodiversiteitswaarneming
- Habitatbeoordeling
- Archeologische vondst
- Milieumonster
- Infrastructuurinspectie
- Vegetatie-inventarisatie
- Schadedocumentatie
Onderzoek & Veldgegevensverzameling inrichten
Beschrijf in één zin waar het om gaat. Daarna staan kaart, categorieën en statussen klaar en kun je alles aanpassen.
Meer sjablonen
Documenteer klimaateffecten zoals hitte-eilanden of overstromingsgebieden op een kaart.
Plekken in kaart brengen
Volg de toestand van wandelpaden: omgevallen bomen, erosie, beschadigde bruggen.
Problemen melden
Bouwgebreken uit grond-, ruw- en installatiebouw documenteren en volgen tot oplevering.
Problemen melden