Daten sammeln im Feld: für Forschung und Bürger-Wissenschaft
Sammle Beobachtungen mit Ort für Forschung und Feld-Studien.
Erzähl uns von deinem Projekt. Wir machen eine Karte für dich.
Was ist ein Werkzeug zum Forschen und Daten sammeln im Feld?
Field data collection with Mark-a-Spot works on any smartphone or tablet. Research teams define their observation categories, each with custom attributes (species name, condition rating, sample type, or whatever the study requires). Contributors open the map, drop a pin at their location, take a photo, fill in the attributes, and submit. The record carries GPS coordinates from the device, a timestamp, and the photo with its EXIF metadata.
Professional researchers use FieldResearch for structured surveys: biodiversity monitoring across transects, archaeological site inventories, tree health assessments, environmental damage mapping after storms or floods. Citizen science projects use the same tool to mobilize volunteers at scale. A university publishes the map link, participants contribute observations from the field, and the dataset grows without hiring additional staff.
Every observation is accessible through the Open311 API, the same open standard used by cities worldwide. Filter by category, date range, or bounding box. Export to CSV for spreadsheets, GeoJSON for QGIS and ArcGIS, or consume the JSON API directly from R, Python, or any analysis pipeline. The dashboard provides visual summaries and direct download.
Data ownership stays with the project. The platform runs on open standards, so data is never locked in. Multi-language support covers 17 languages, making it suitable for international research collaborations. Photo documentation with GPS metadata provides verifiable evidence chains for regulatory compliance, academic publications, and long-term monitoring programs.
Fuer wen ist das?
Gruppen vor Ort
Anwohner, Eltern, Nachbarschafts-Gruppen. Sie sammeln Daten aus der Umgebung.
Organisationen
Vereine und Forschungs-Gruppen. Sie machen Karten-Projekte zusammen mit anderen.
Staedte und Gemeinden
Verwaltungen und Behoerden. Sie verwalten viele Meldungen von Buergern.
Wofuer ist das gut?
Für Universitäten und Forschung
Forscher sammeln Daten im Feld. Jede Beobachtung hat einen Ort, ein Foto und eigene Merkmale. Die Daten können als Datei gespeichert werden.
Für Umwelt-Behörden
Umwelt-Zustände über ein großes Gebiet beobachten. Fotos zeigen, was passiert ist. Die Daten haben Zeit und Ort.
Für Archäologie
Funde mit genauem Ort und Foto speichern. Man kann eigene Merkmale wählen, zum Beispiel Zeit-Alter oder Material.
Für Mitmach-Forschung
Viele Freiwillige helfen bei der Daten-Sammlung. Sie öffnen einen Link und tragen Beobachtungen vom Handy ein.
Diese Gruppen sind dabei
Die haeufigsten Meldungen sind kaputte Strassen, defekte Lampen, illegaler Muell, Graffiti und mehr. Jede Gruppe kann spaeter im Dashboard geaendert werden.
Das bekommst du
Custom Attributes per Category
Each observation category (Service Definition) carries its own attribute set: species name, condition rating, sample type, material, or any field your study needs. Configured in the admin panel, no code changes required.
GPS Photo Documentation
Every record includes a photo with GPS coordinates and EXIF metadata from the device. The combination of visual evidence and precise location creates a verifiable record chain for publications and regulatory compliance.
Open311 API Export
All data is accessible through the Open311 API. Filter by category, date, or bounding box. Export to CSV, GeoJSON, or JSON for direct use in R, Python, QGIS, ArcGIS, and any analysis pipeline.
Multi-language Support
The platform supports 17 languages, making it suitable for international research collaborations and cross-border citizen science projects. Categories and attributes can be localized.
So sieht es aus
Von der Meldung bis zur Auswertung
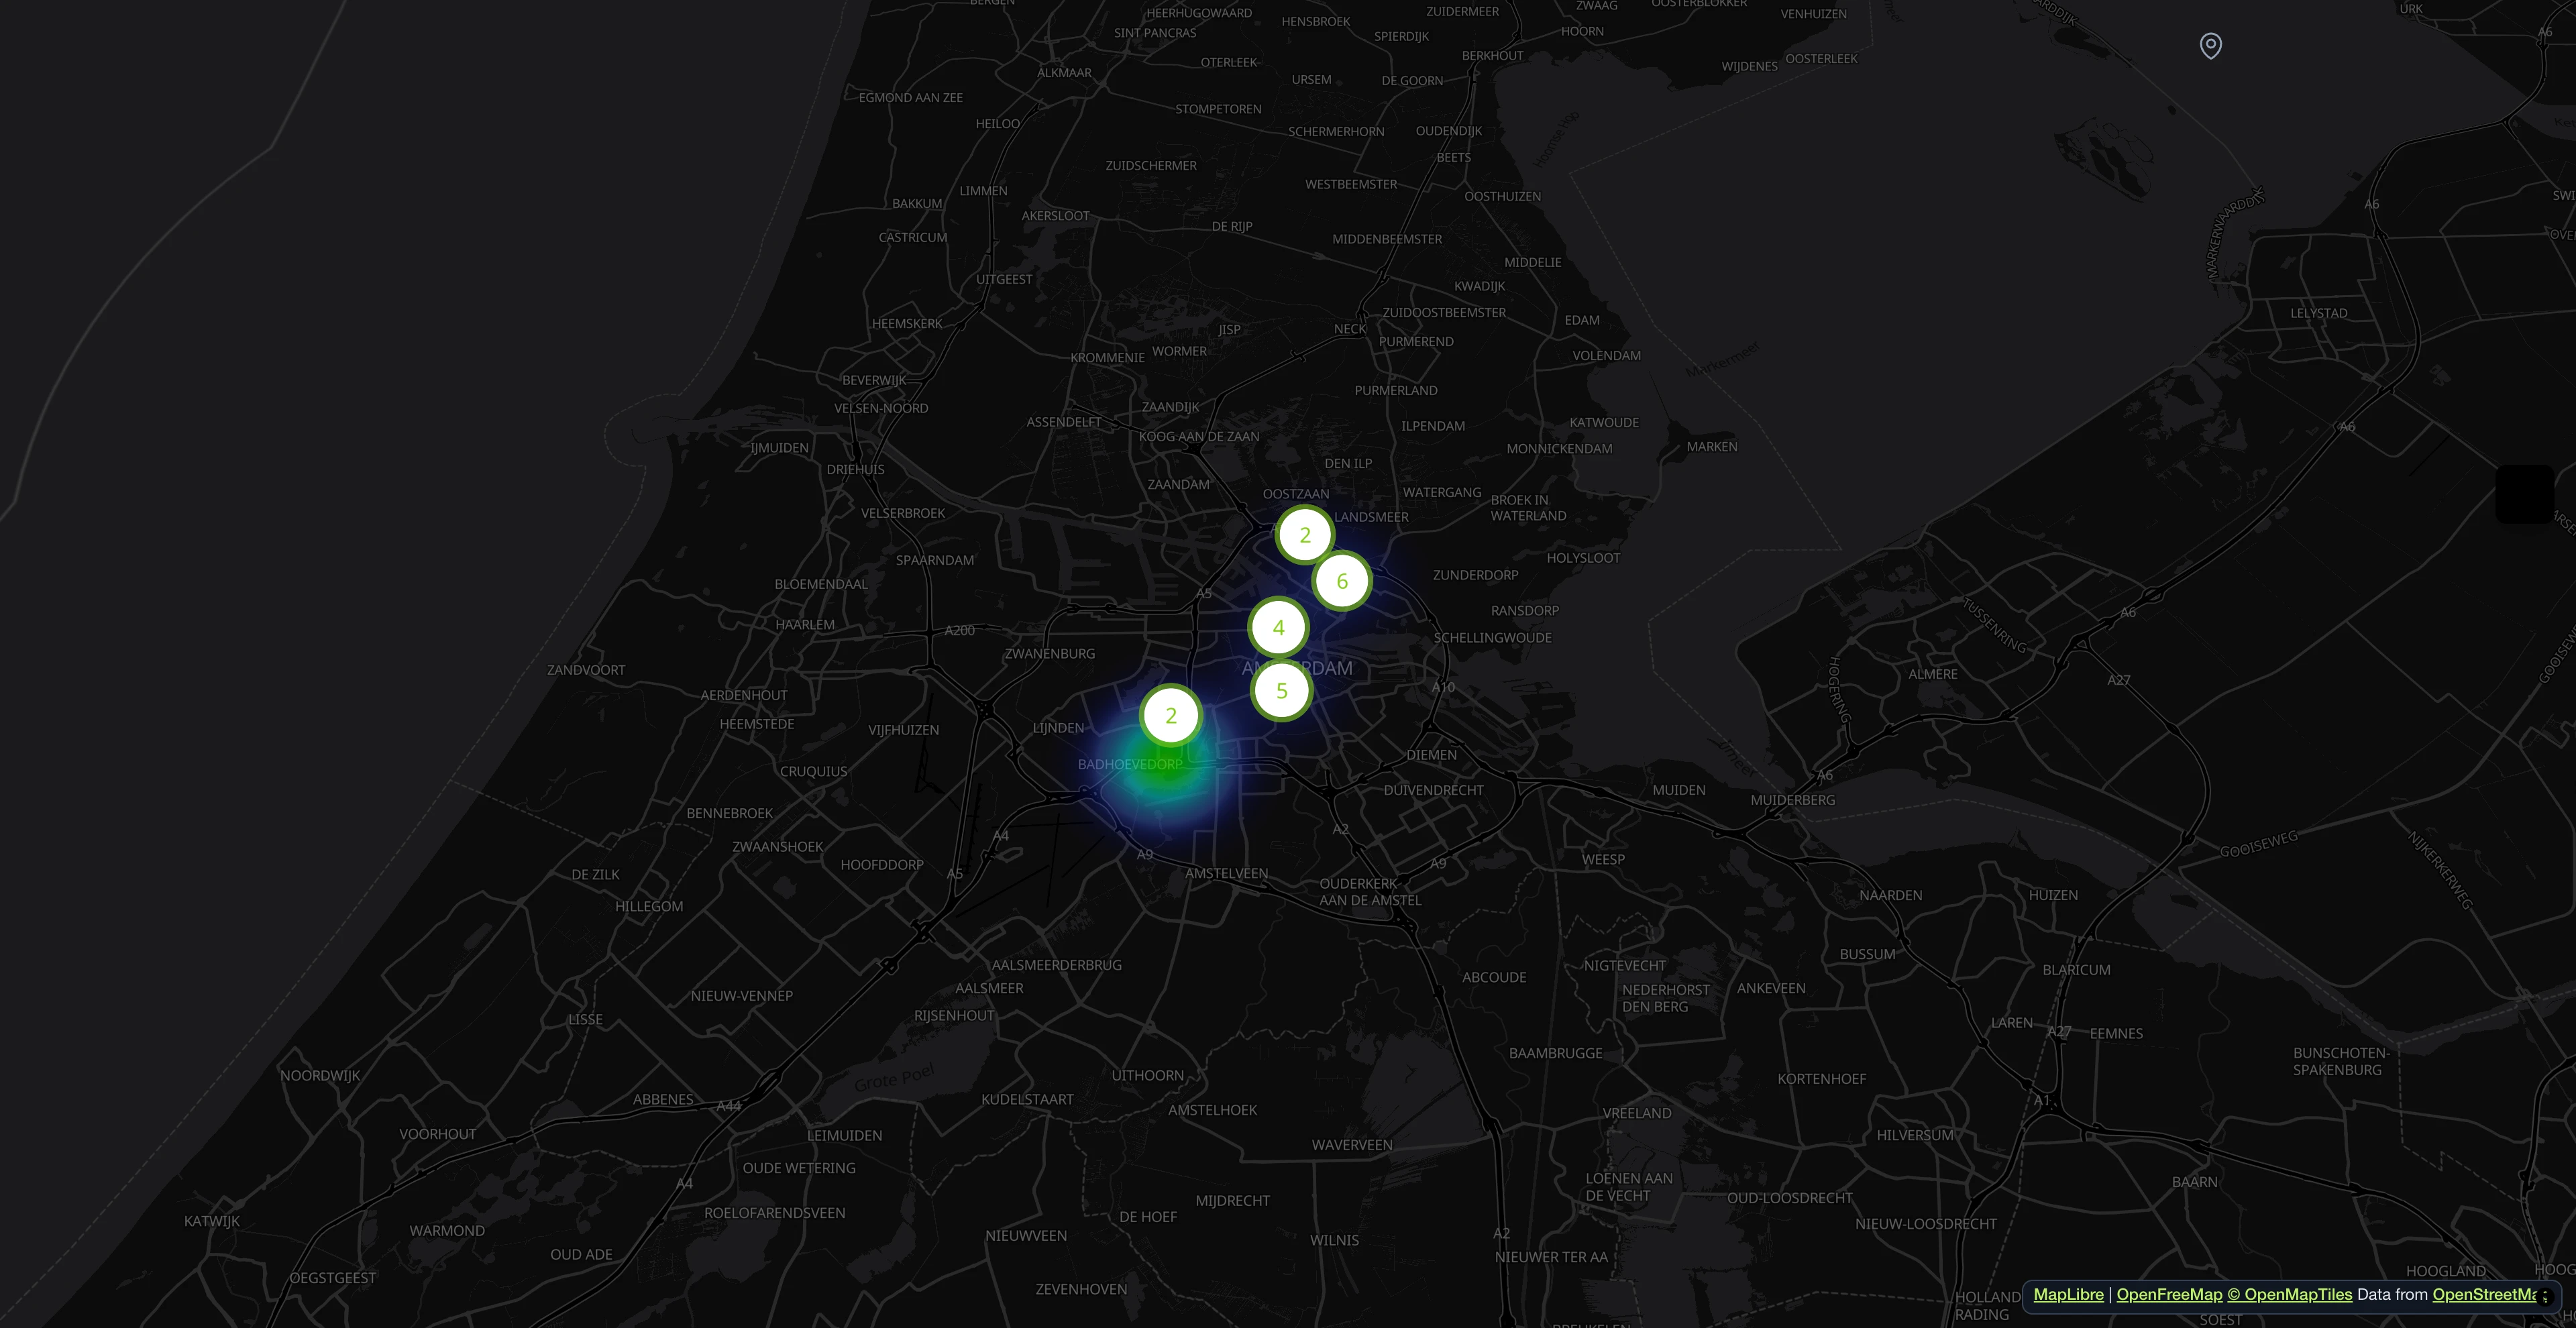
Menschen markieren Probleme mit Foto und Ort. Die Punkte auf der Karte werden nach Gruppen sortiert und farbig angezeigt.
Foto machen, KI erledigt den Rest
Leute laden ein Foto hoch. Die KI erkennt die Gruppe, schreibt eine Beschreibung und füllt Felder in Echtzeit. Melder prüft und schickt ab.

Meldungen auf einer Karte
Menschen markieren Probleme mit Foto und Ort. Die Punkte auf der Karte werden nach Gruppen sortiert und farbig angezeigt.

Alle Meldungen auf einen Blick
Suchen, filtern und sortieren. Abteilungen zuweisen, Stand ändern und jede Meldung von Anfang bis Ende verfolgen.

Die KI schreibt die Meldung für dich
Foto hochladen, und das System macht eine Beschreibung, erkennt Merkmale und bewertet die Gefahr. Vor dem Absenden kannst du alles ändern.

KI-Verarbeitungspipeline
Meldungen werden auf Doppelte geprüft, nach Gefahr eingestuft, für Stimmung bewertet und mit Gruppen-Merkmalen gefüllt. Läuft von selbst im Hintergrund.

Open311-konformer Service-Katalog
Jede Gruppe ist ein Open311-GeoReport-v2-Service mit Merkmalen, Auswahl-Listen und Texten in mehreren Sprachen. Kein Anbieter-Zwang.

Alles auf einer Seite
Zahlen sehen, Meldungen bearbeiten, Teams zuweisen. KI prüft Fotos auf Gefahren und Stimmung.

- Über 1 Mio. Meldungen seit 2011
- Open Source
- Open311 GeoReport v2
- EU-gehostet
Live ausprobieren:demo.mark-a-spot.com/amsterdam
Du brauchst mehr? Zum Beispiel Facility Management, eigene Karten-Layer, eigene Daten-Felder pro Status oder mehrere Städte? Schau dir die ganze Plattform an aufmark-a-spot.com
Jetzt starten: Forschung und Daten sammeln im Feld
Erzaehl uns von deinem Projekt. Wir richten alles fuer dich ein.